Everything that happens around the trade.
Plan it, record it, replay it, and find out what you actually do well — in one place, instead of a spreadsheet, a notes app and a folder of screenshots.
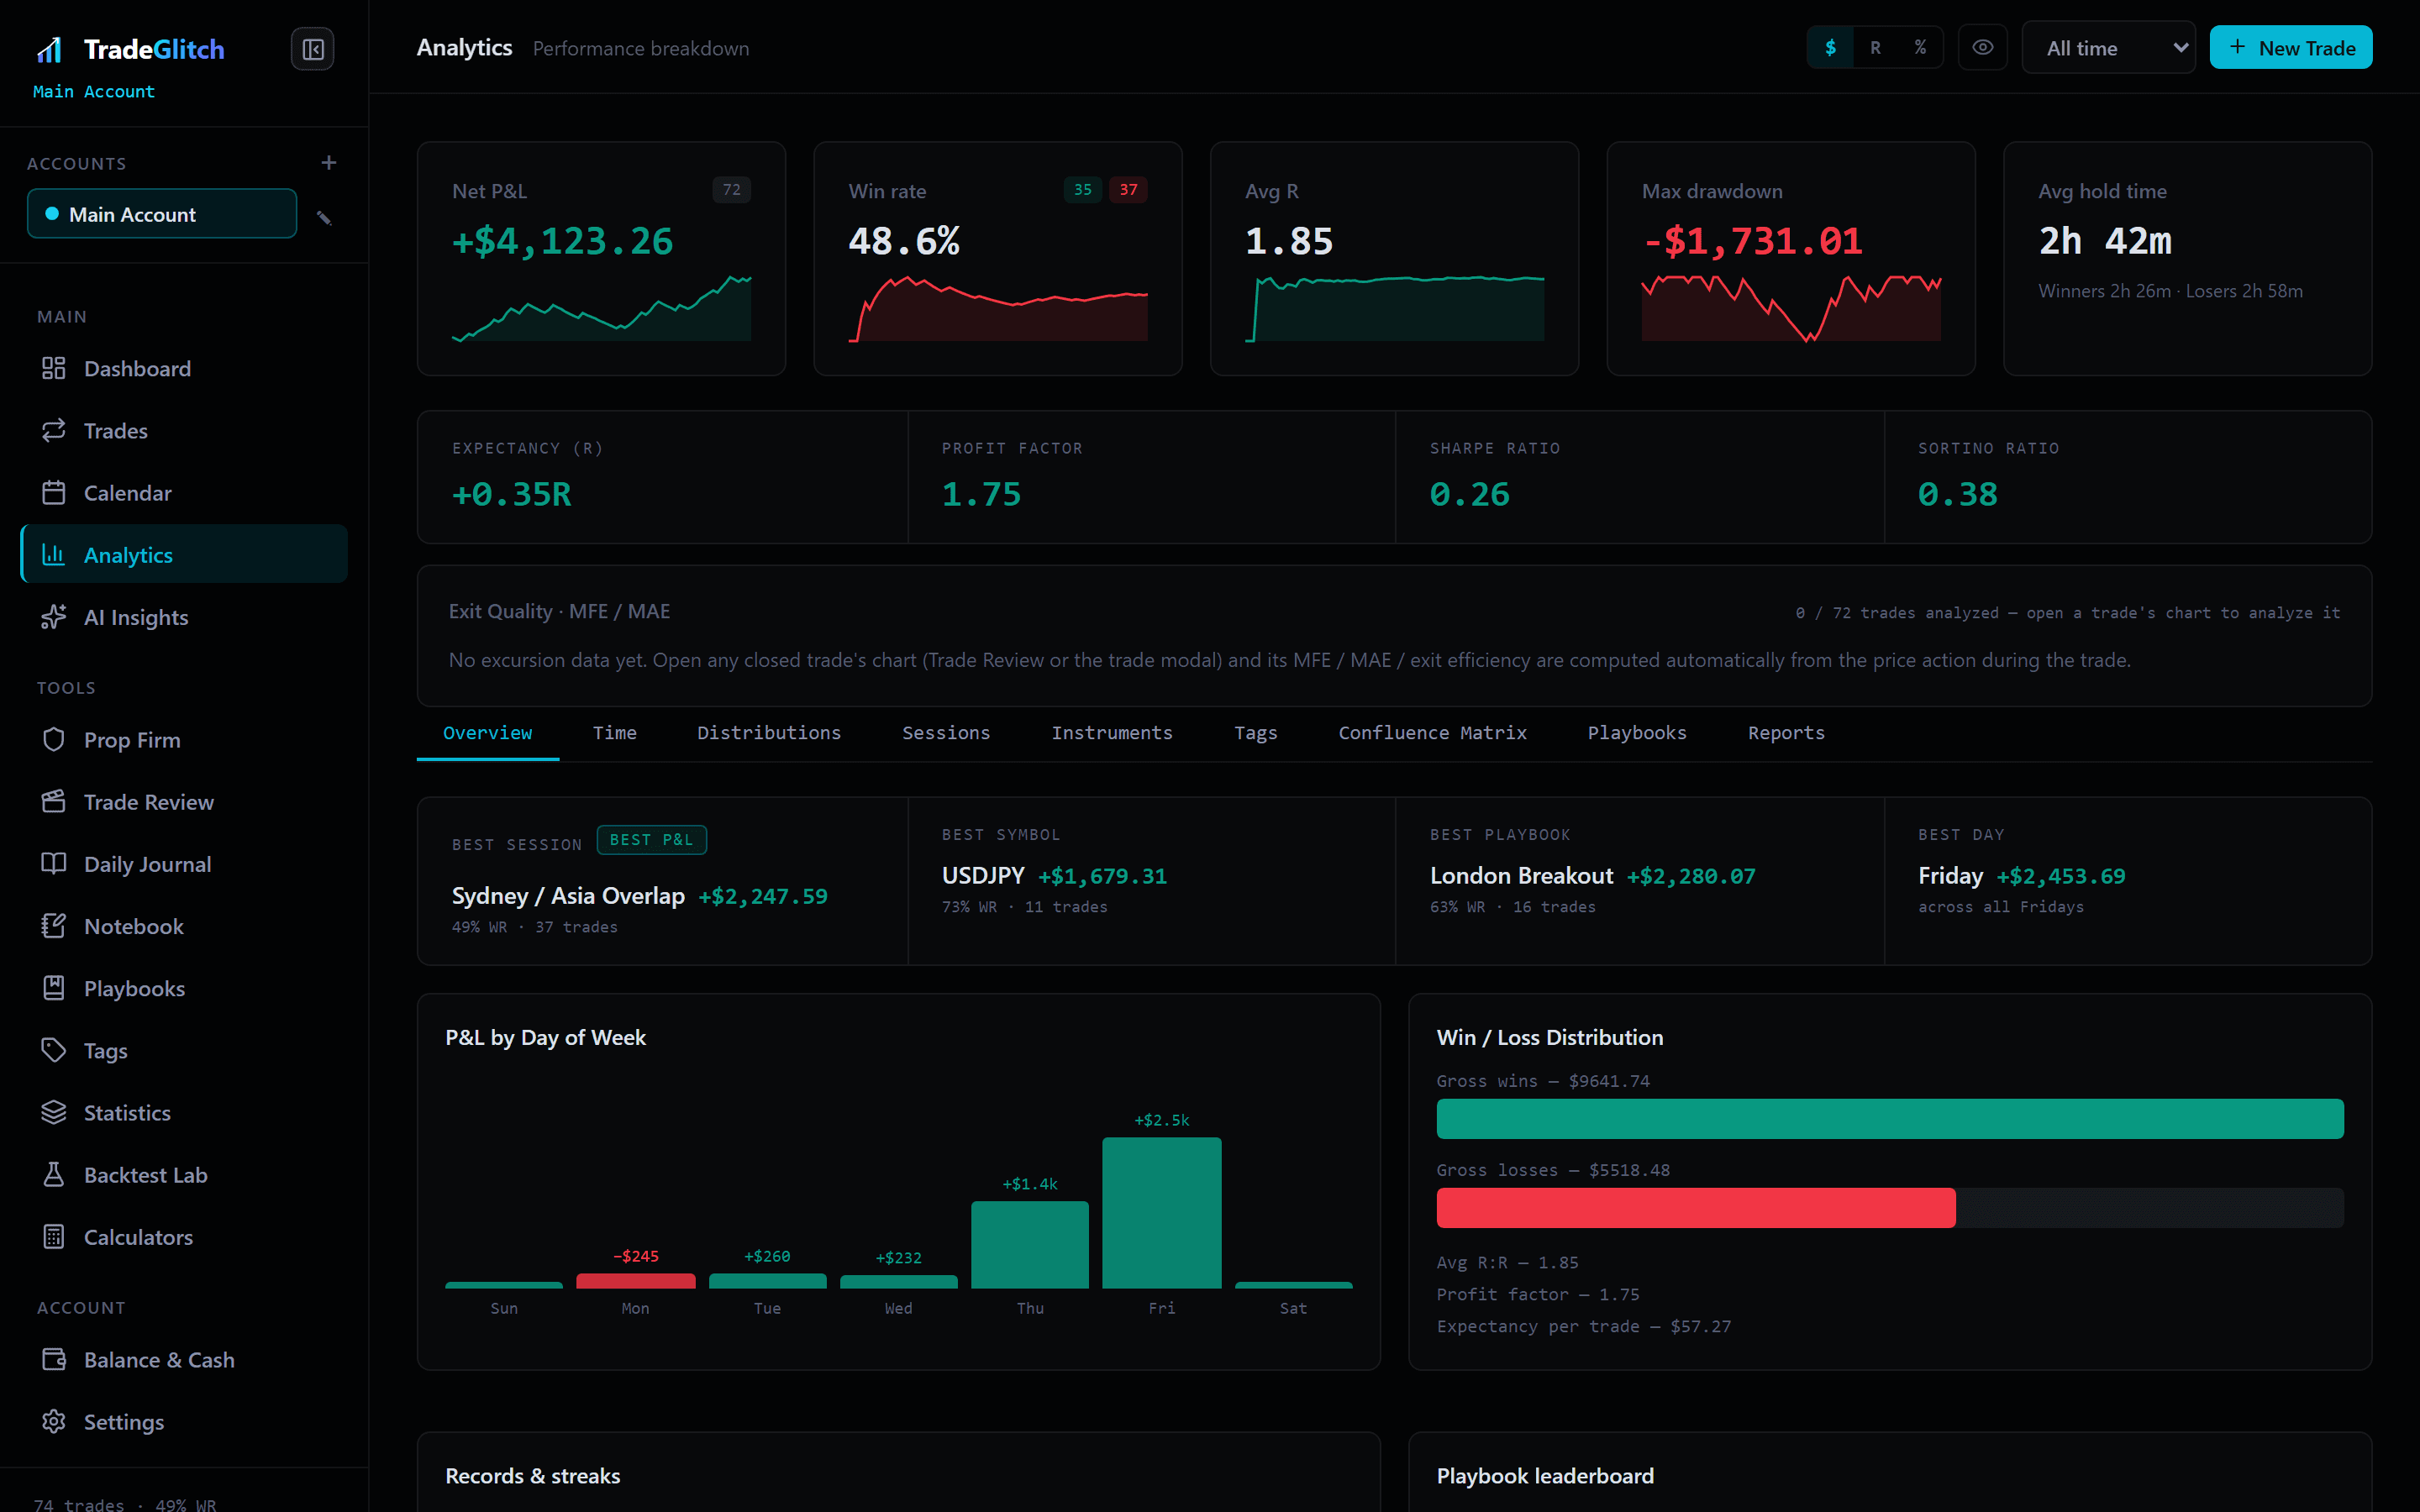
Every trade, and the reason you took it.
Log entries, exits, stops, targets, size and fees, then attach the chart screenshot and what you were thinking at the time. Months later, that context is the difference between a list of numbers and something you can actually learn from — and it takes seconds, not a spreadsheet.
- Stocks, forex, futures and options, with the right fields for each
- Screenshots, notes and playbooks attached to every trade
- Separate accounts for live, demo and each prop firm challenge
- Tag by stage of the trade — setup, entry, exit, emotions — not one flat list
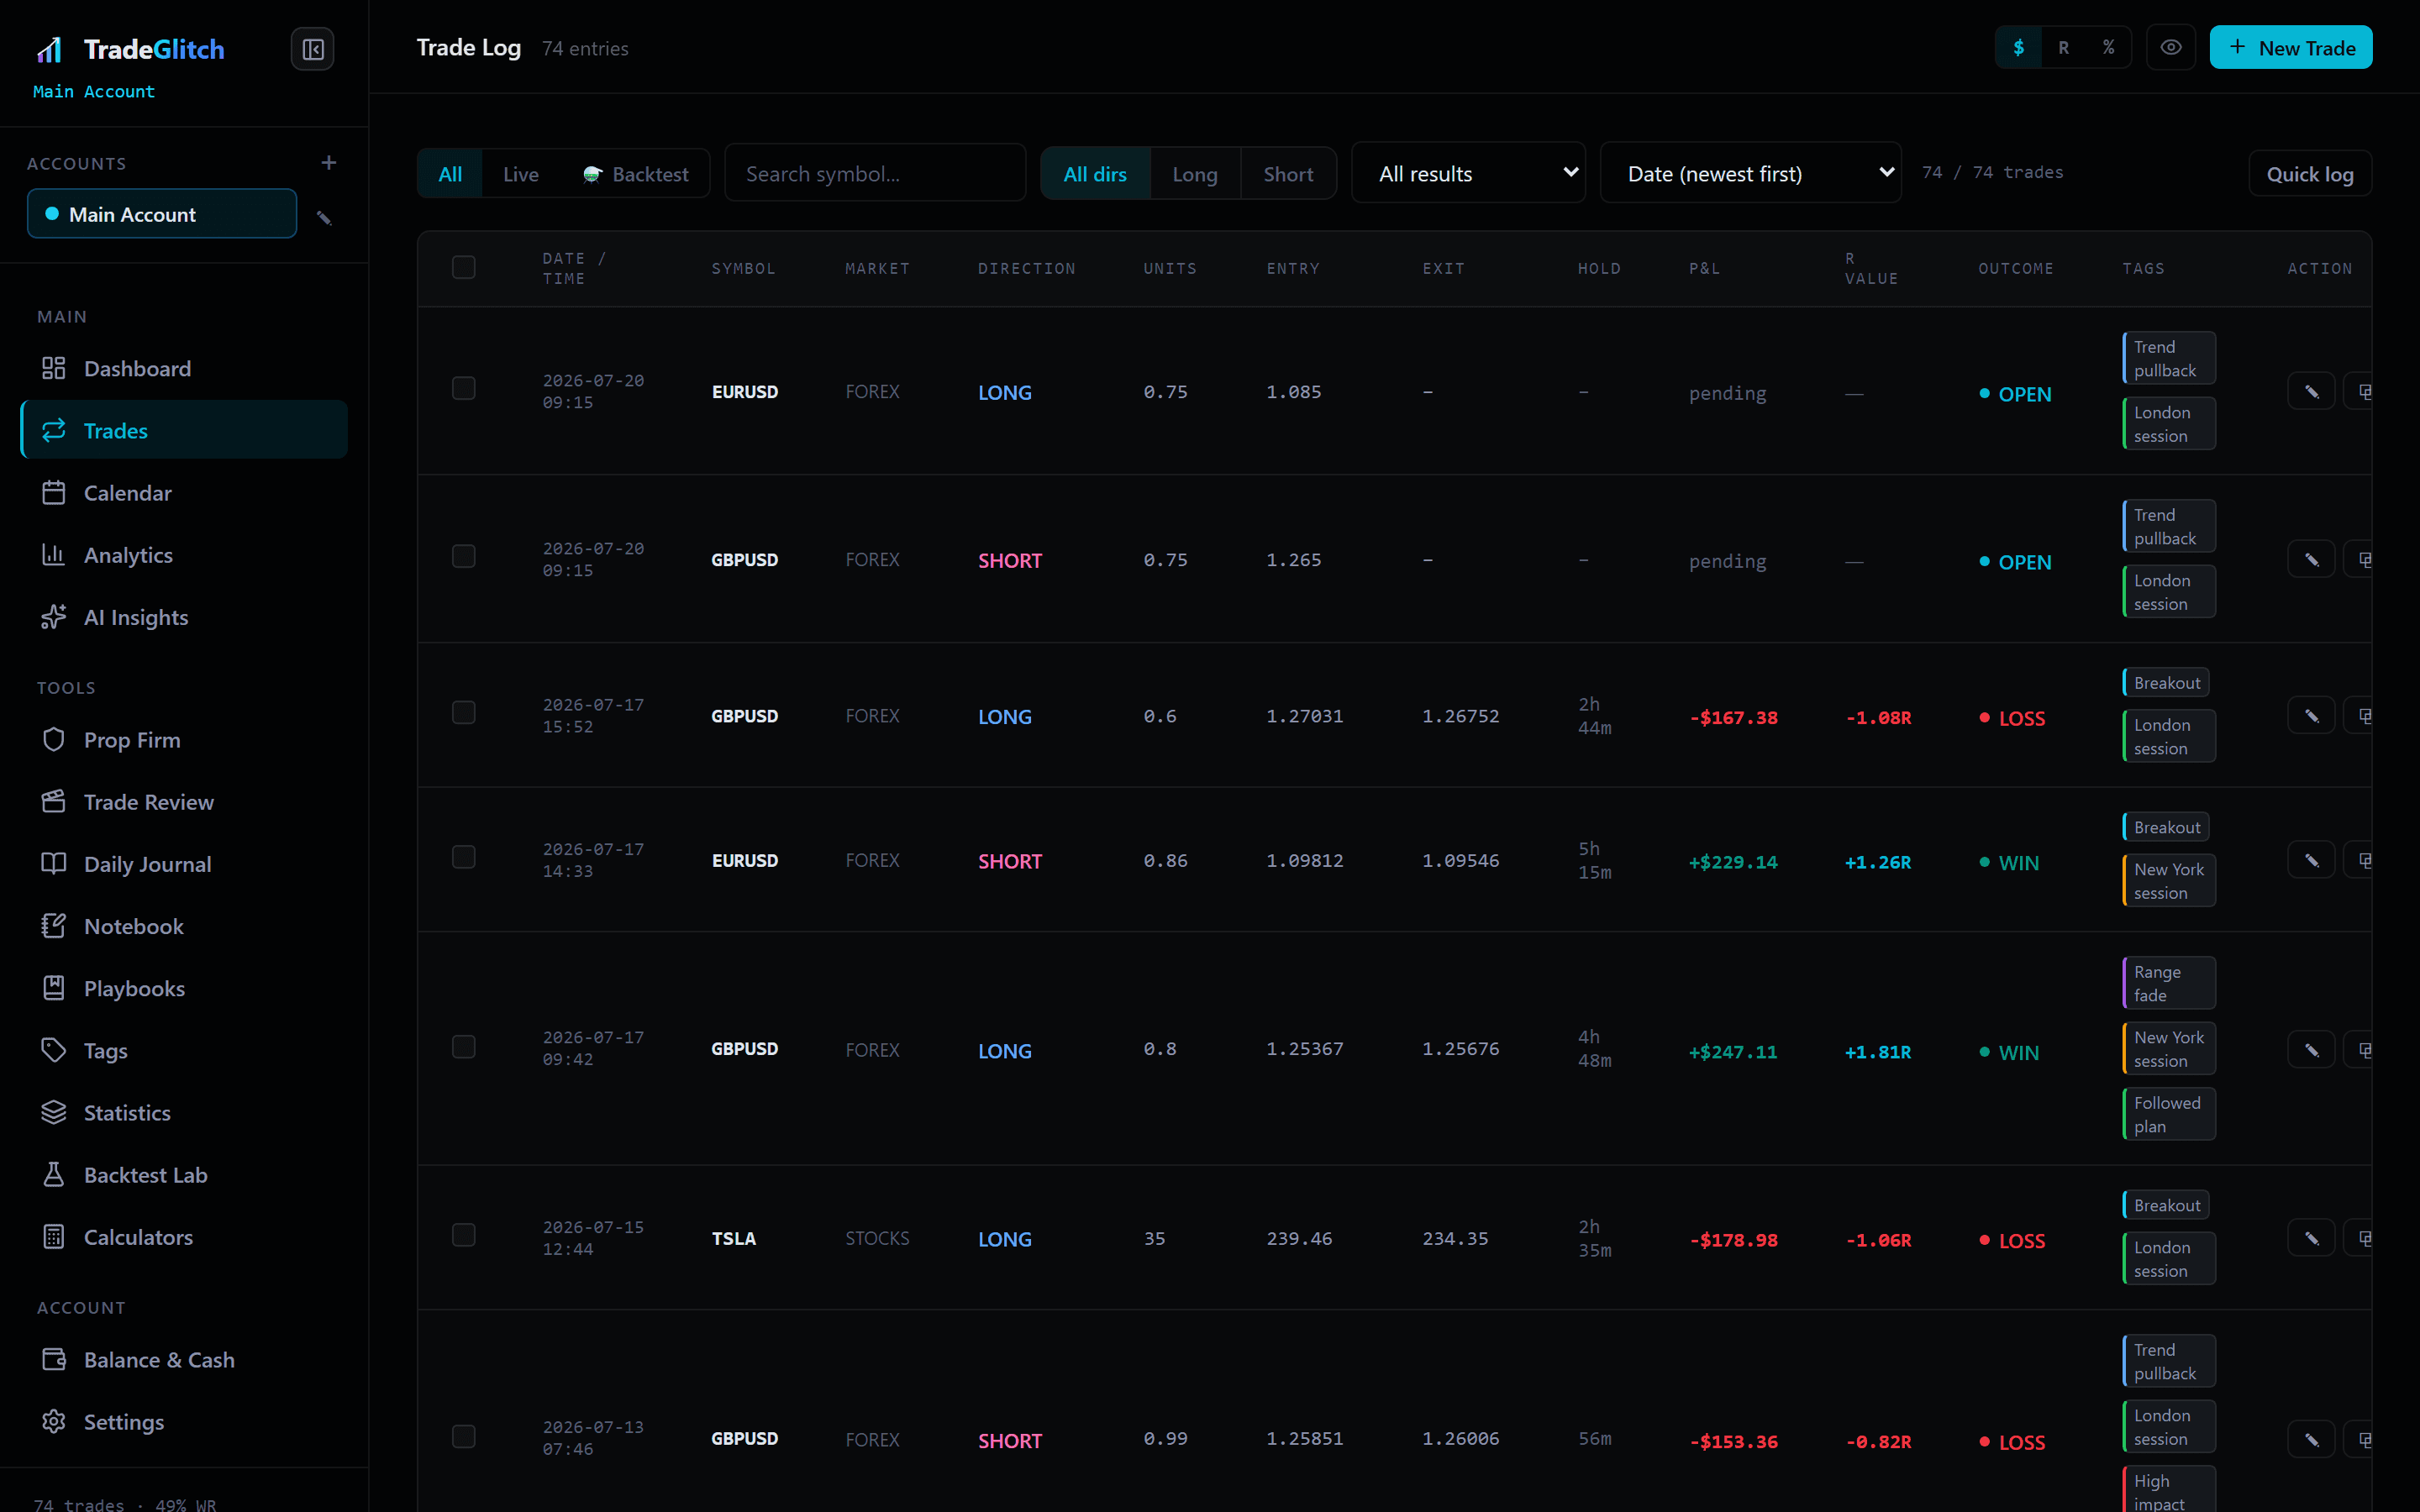
The first screen shows what you care about.
Nobody trades the same way, so nobody needs the same dashboard on opening the app. Choose the panels, drag them into the order you want and set how wide each one runs. You do it on the dashboard itself, not in a settings dialog — the page under your cursor is the result, so you can see a change rather than guess at it and go back to check.
- 23 panels to choose from, including any Statistics breakdown and any Analytics view
- Drag to reorder, and the rest of the page moves aside as you go
- Four widths, from a third of a row to the full width
- Add the same breakdown twice, set to different things, and compare them side by side
- On every plan, including the free trial
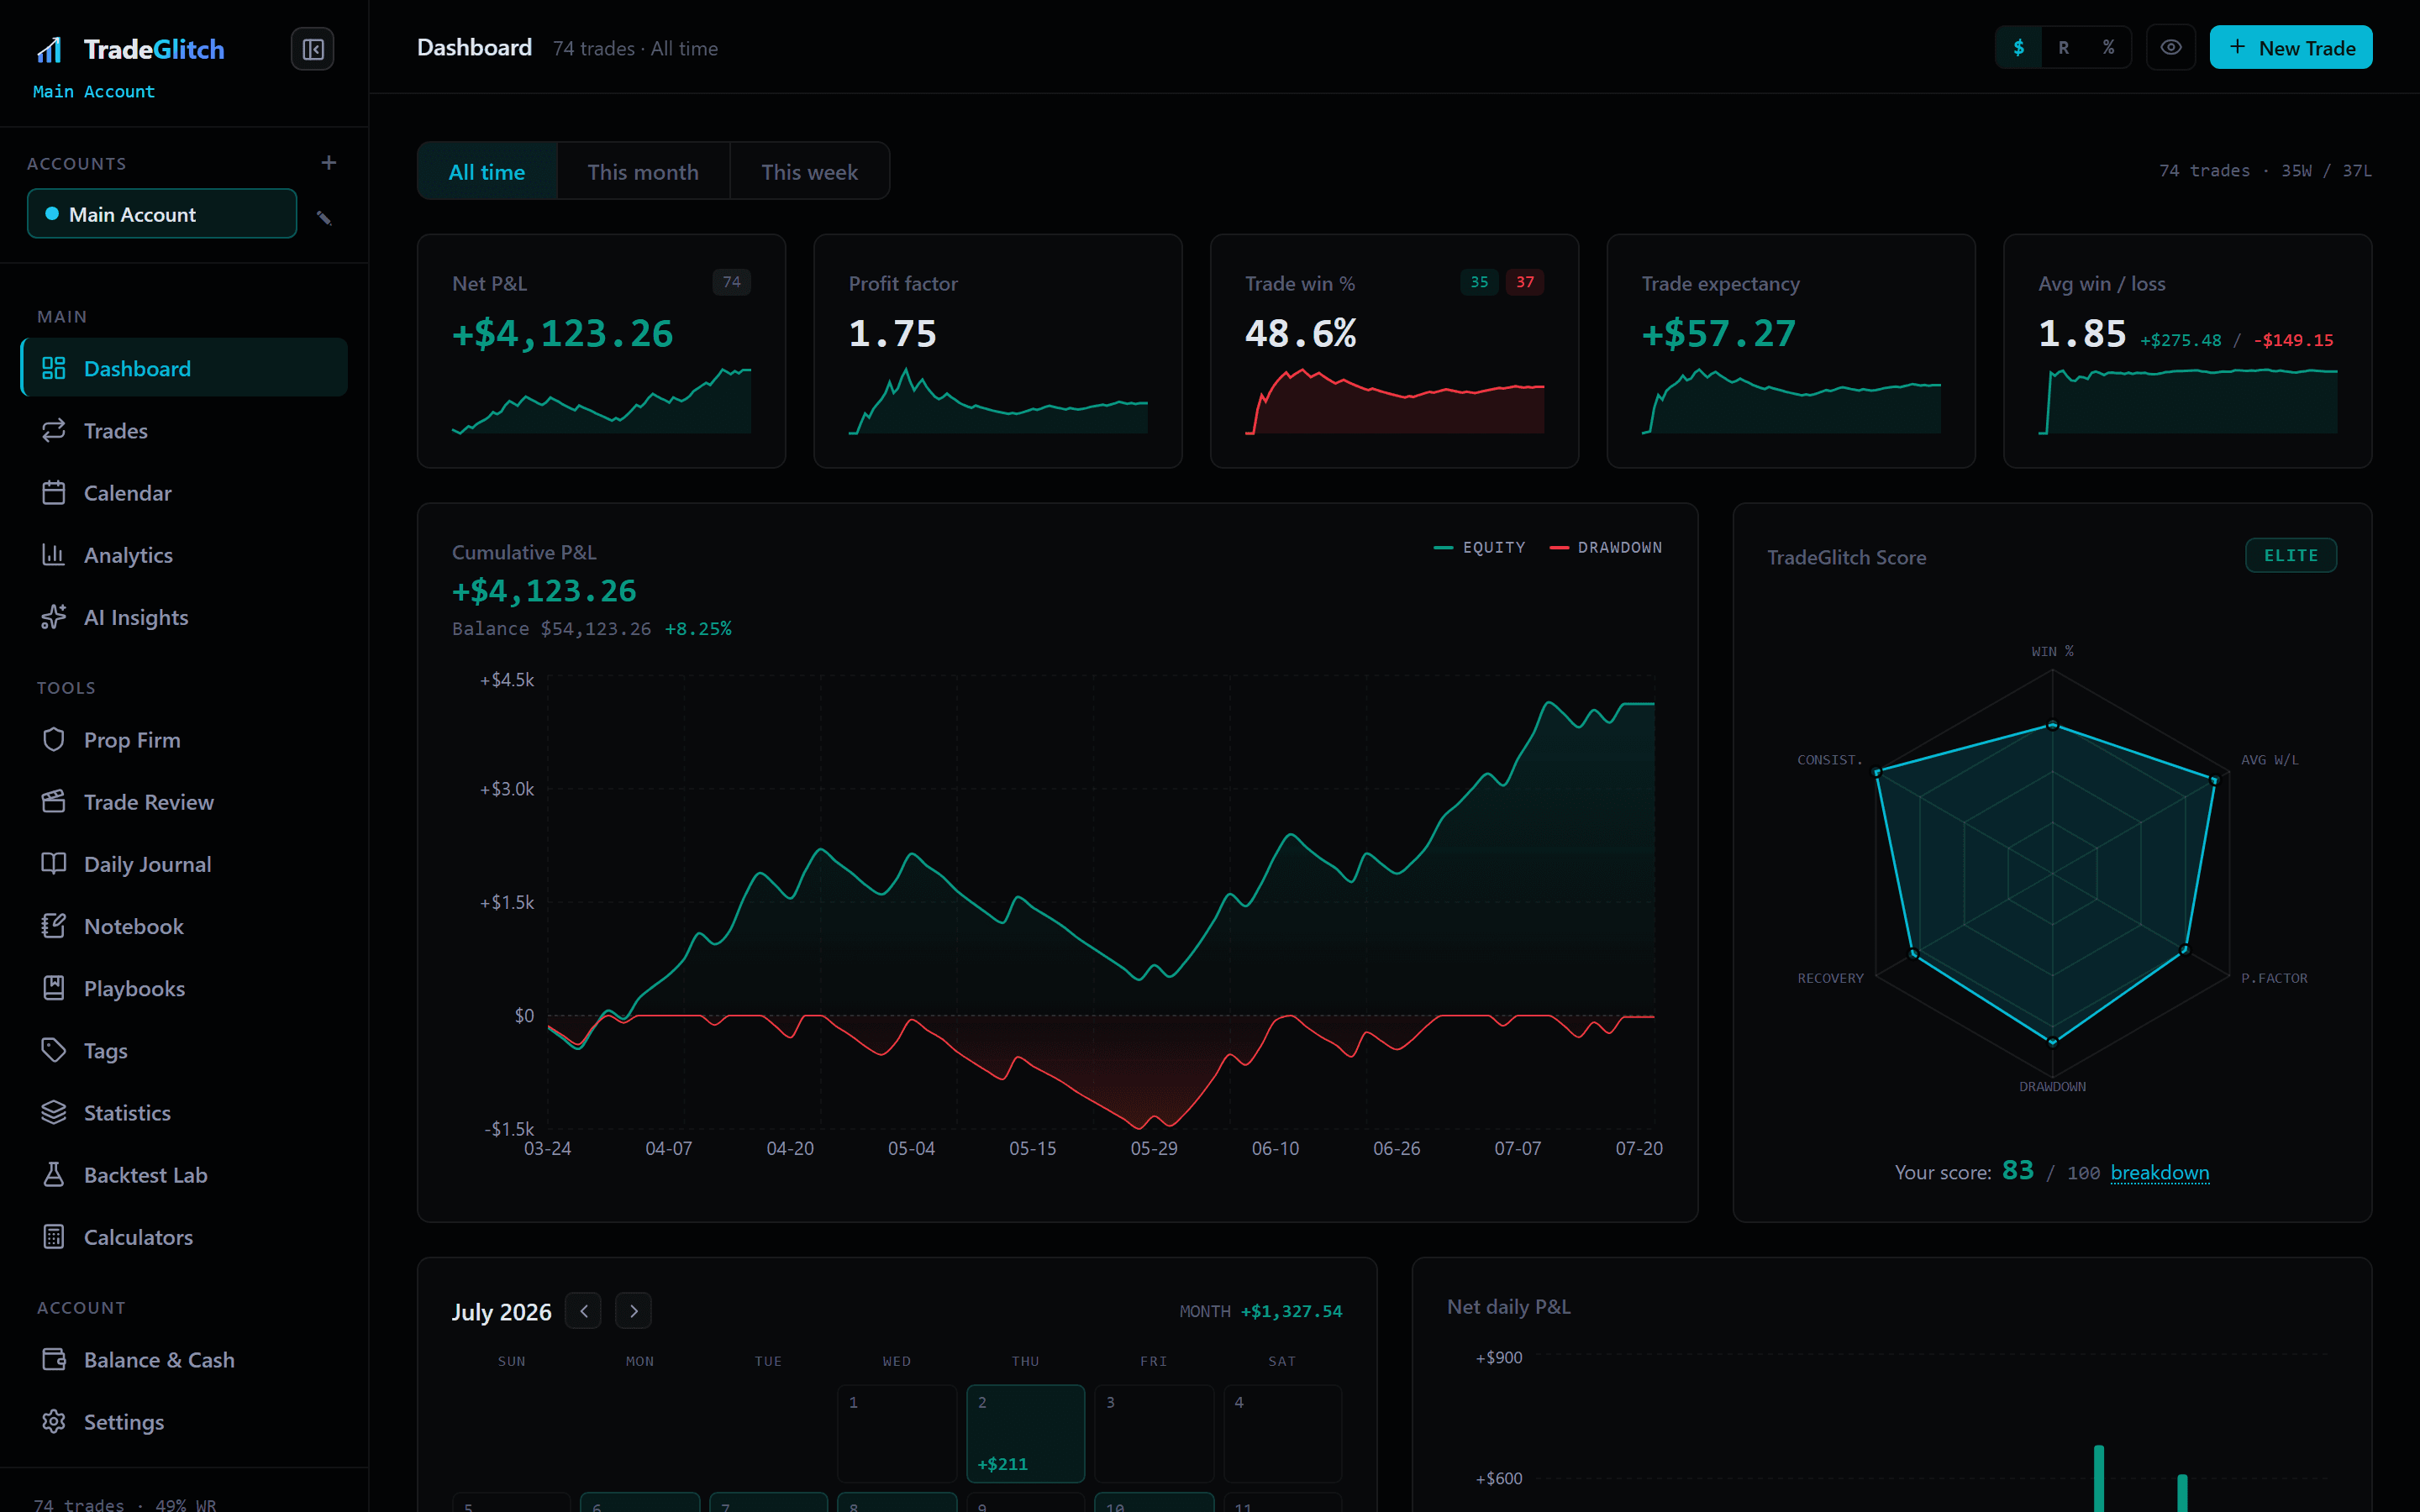
Know which open positions need you, before the open.
Every morning, a read on the trades you're still in: what's sitting on its stop, what's nearly at target with little left to make, and what it costs you if everything stops out from here. It's built from the stops and targets you recorded, so every number in it is your own — nothing is estimated and nothing is predicted.
- Sorted by what can hurt you, not by date
- Distance to your stop and target, open R, and R still on the table
- Positions with no stop recorded are called out, not quietly skipped
- Up to 10 positions on Pro, 50 on Elite — you choose which ones
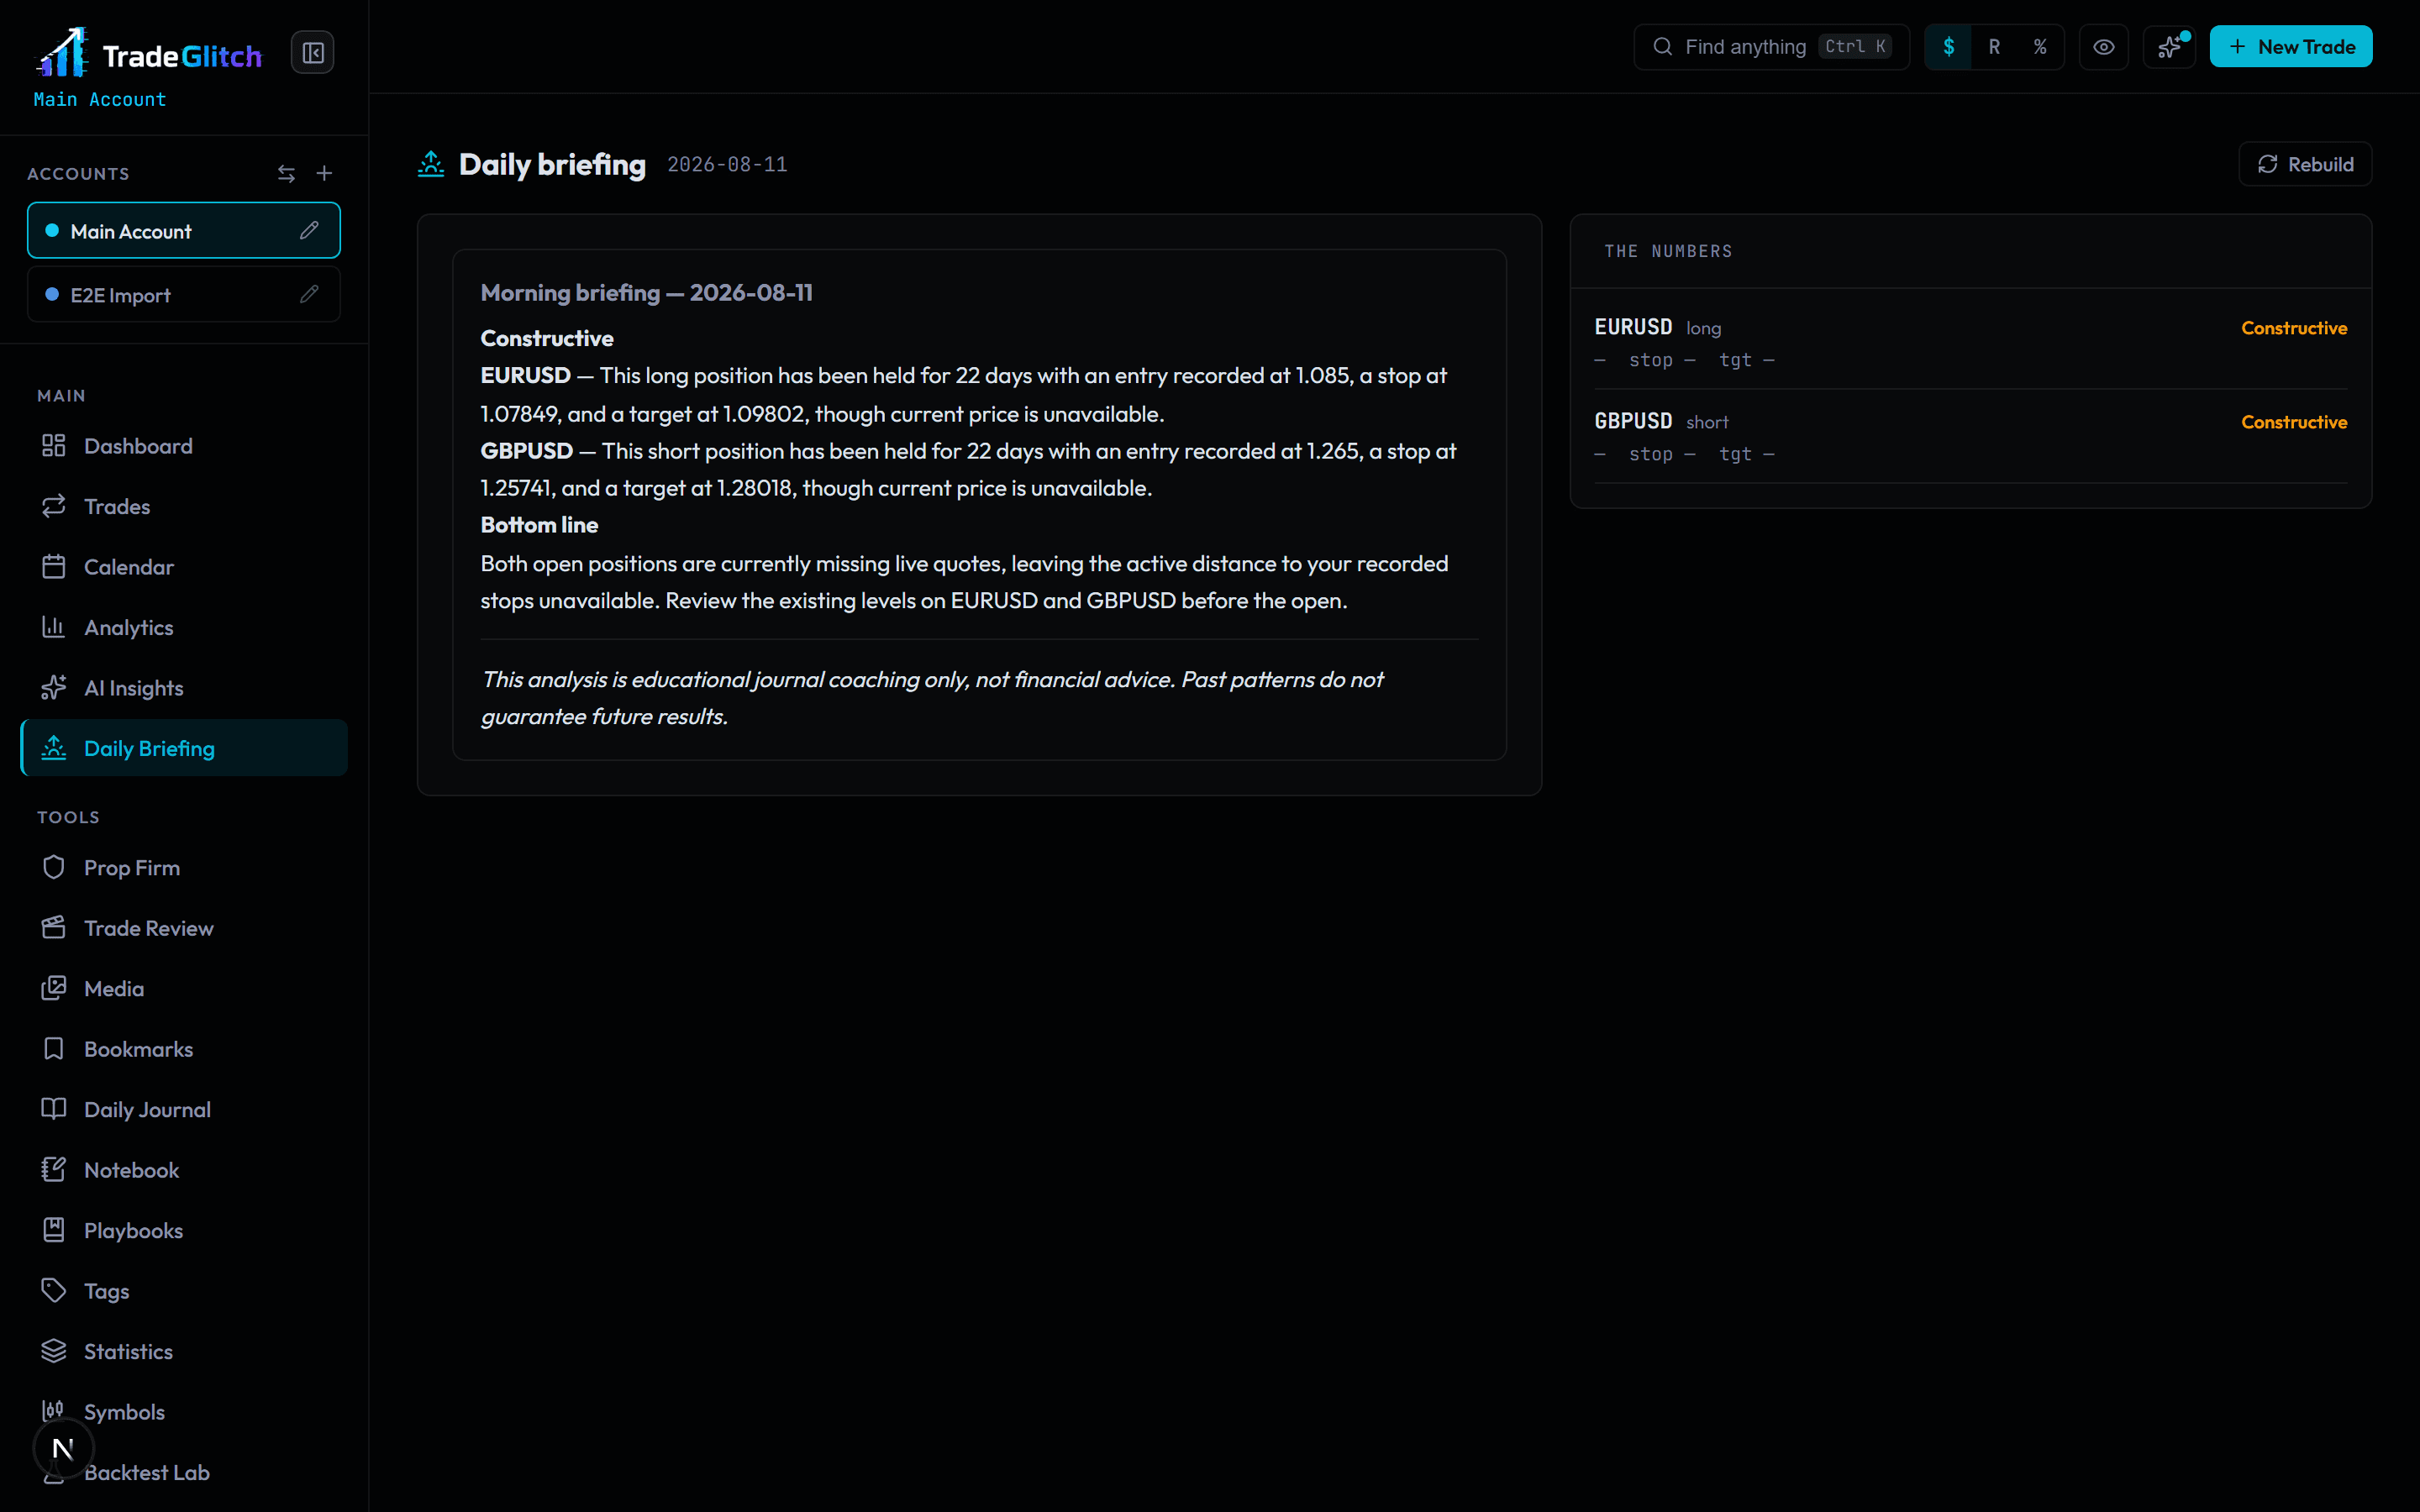
Find out what's actually making the money.
Most traders have a rough idea of what works. This replaces the rough idea. Break your history down by session, symbol, day of week, setup or tag and see where the profit genuinely comes from — and, more usefully, which habit is quietly cancelling it out.
- Win rate, expectancy, profit factor and average R
- Session, symbol and weekday breakdowns
- Confluence matrix — which combinations of conditions actually pay
- Build and save your own reports: any metric, grouped any way
Turn repeated mistakes into rules you can track.
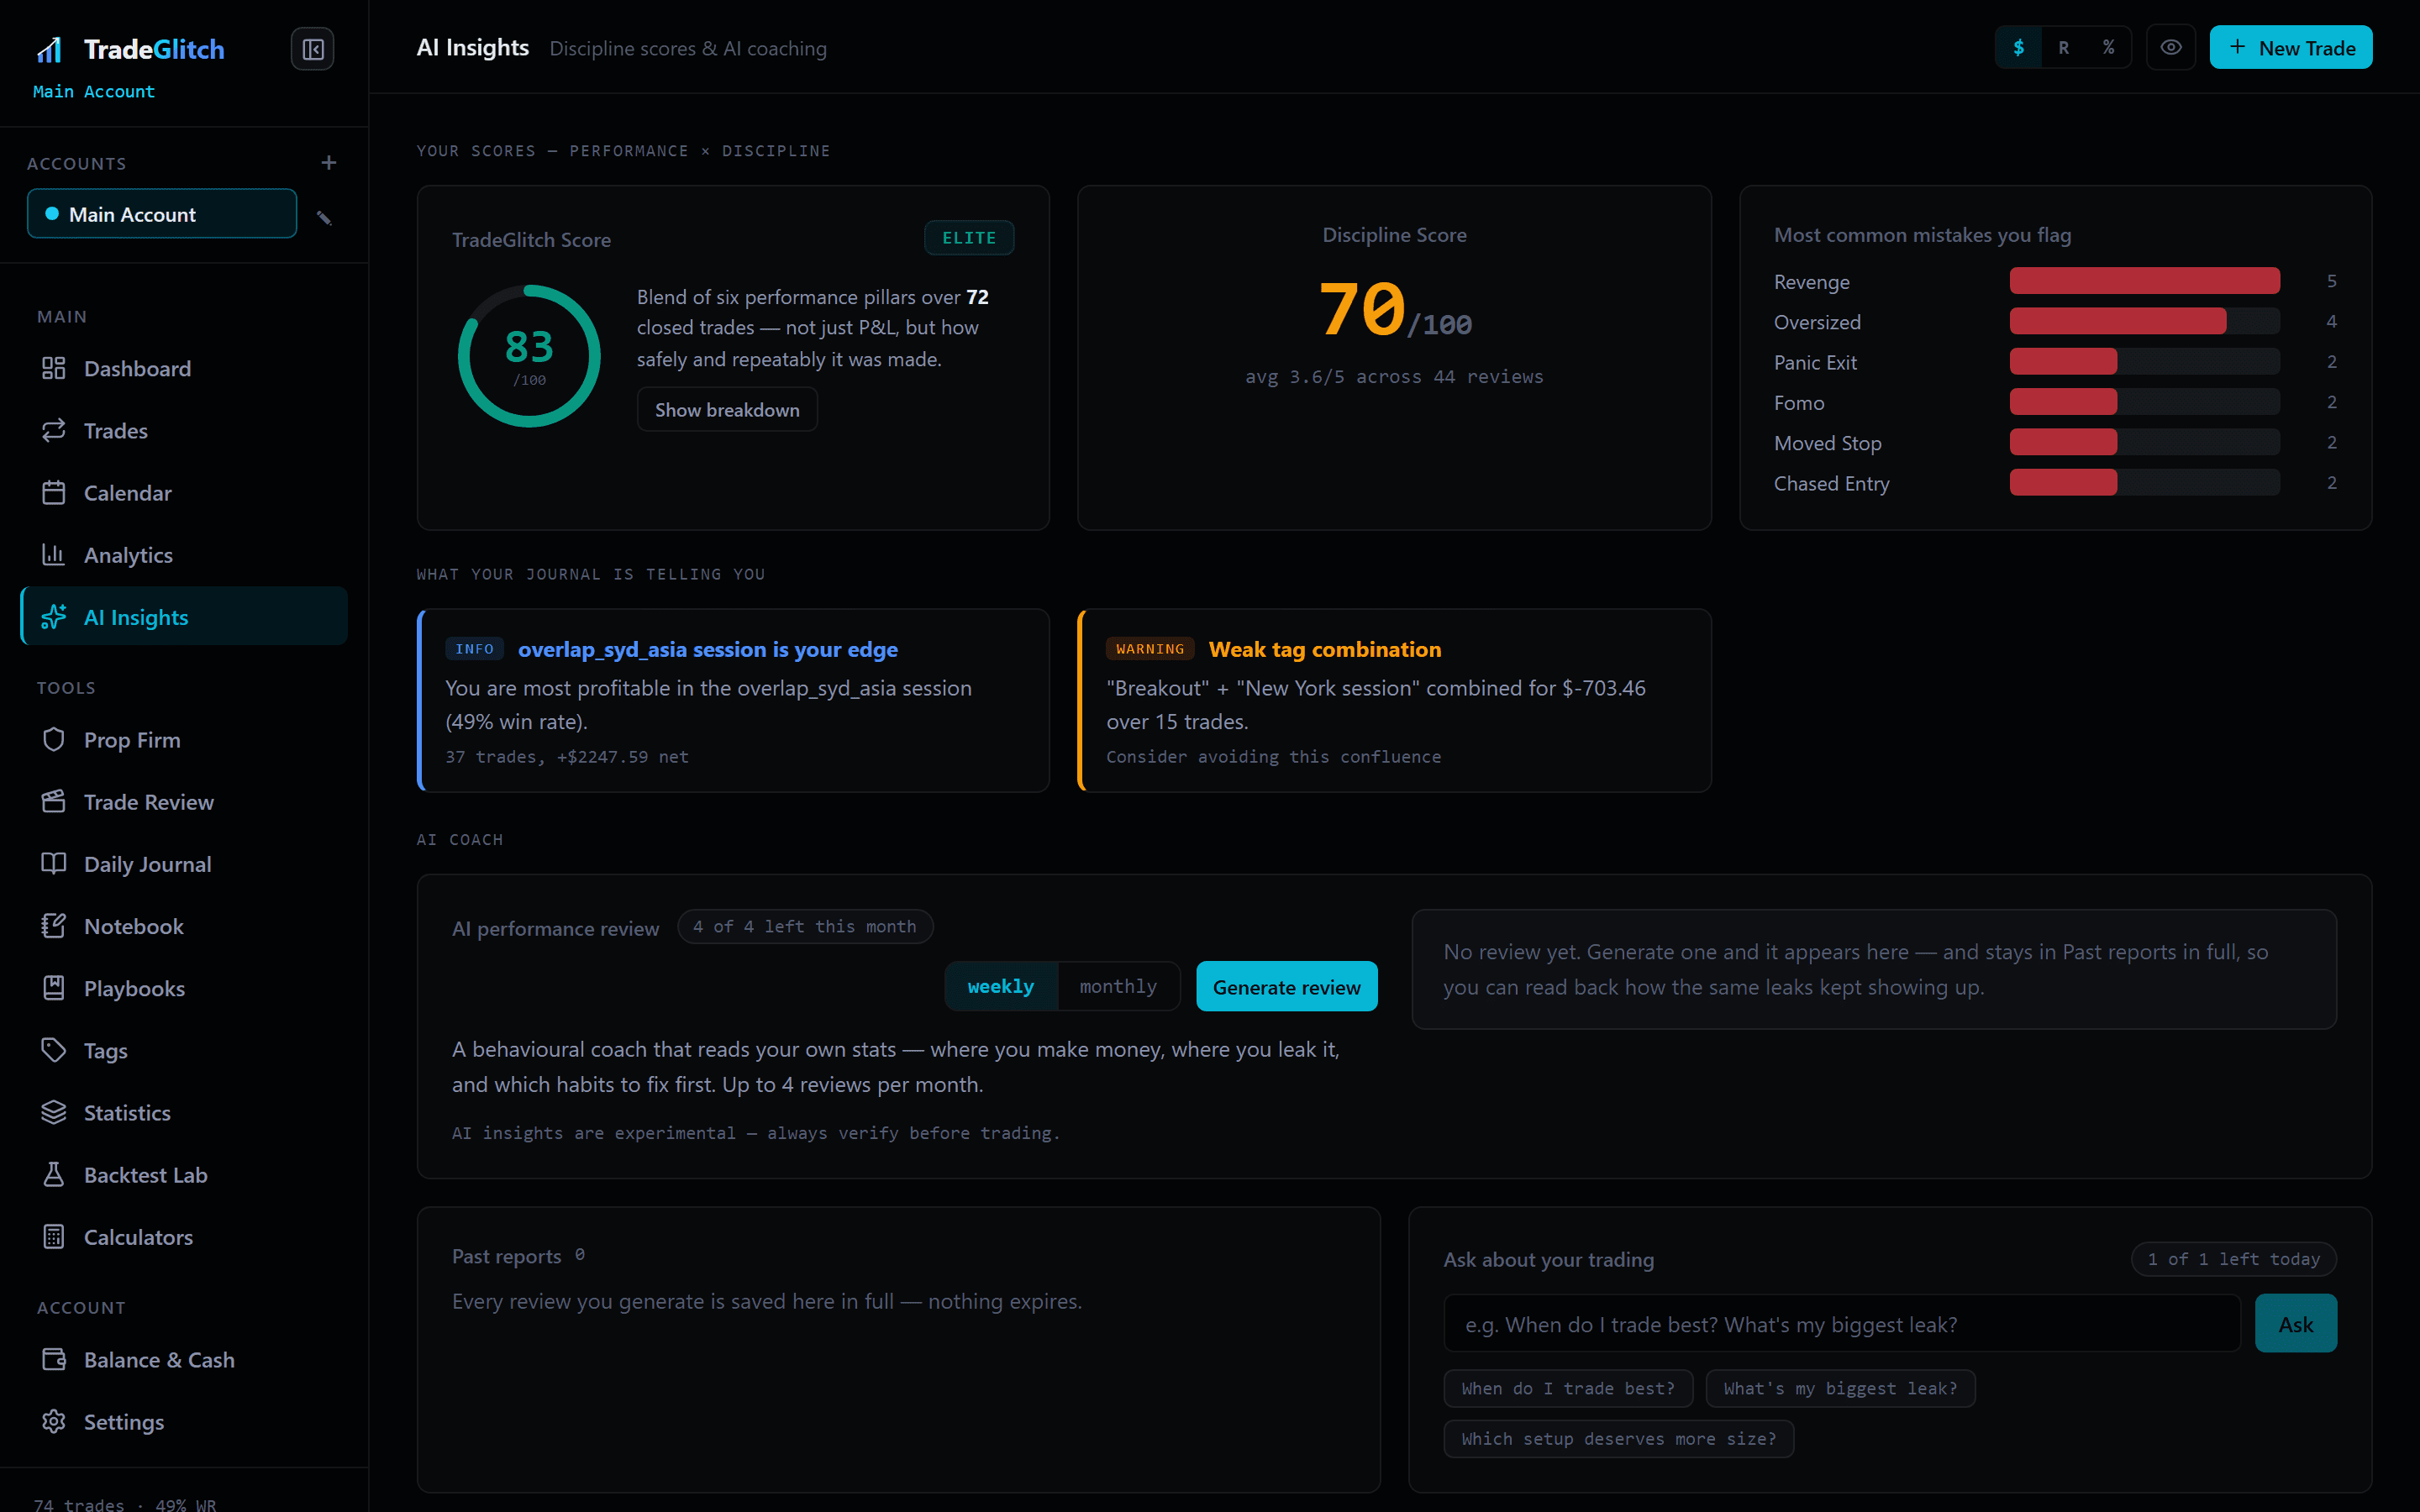
A rules engine reads your own trade history and names the patterns costing you money — no black box, every claim tied to a number you can check yourself. On top of that sits an AI coach that writes your weekly or monthly review from the same figures, and answers questions about your journal in plain English.
- Discipline score built from your own trade reviews
- Rules-based findings, each backed by your numbers
- Weekly and monthly AI reviews written from your data
- Ask it anything: “when do I trade worst?”, “what's my biggest leak?”
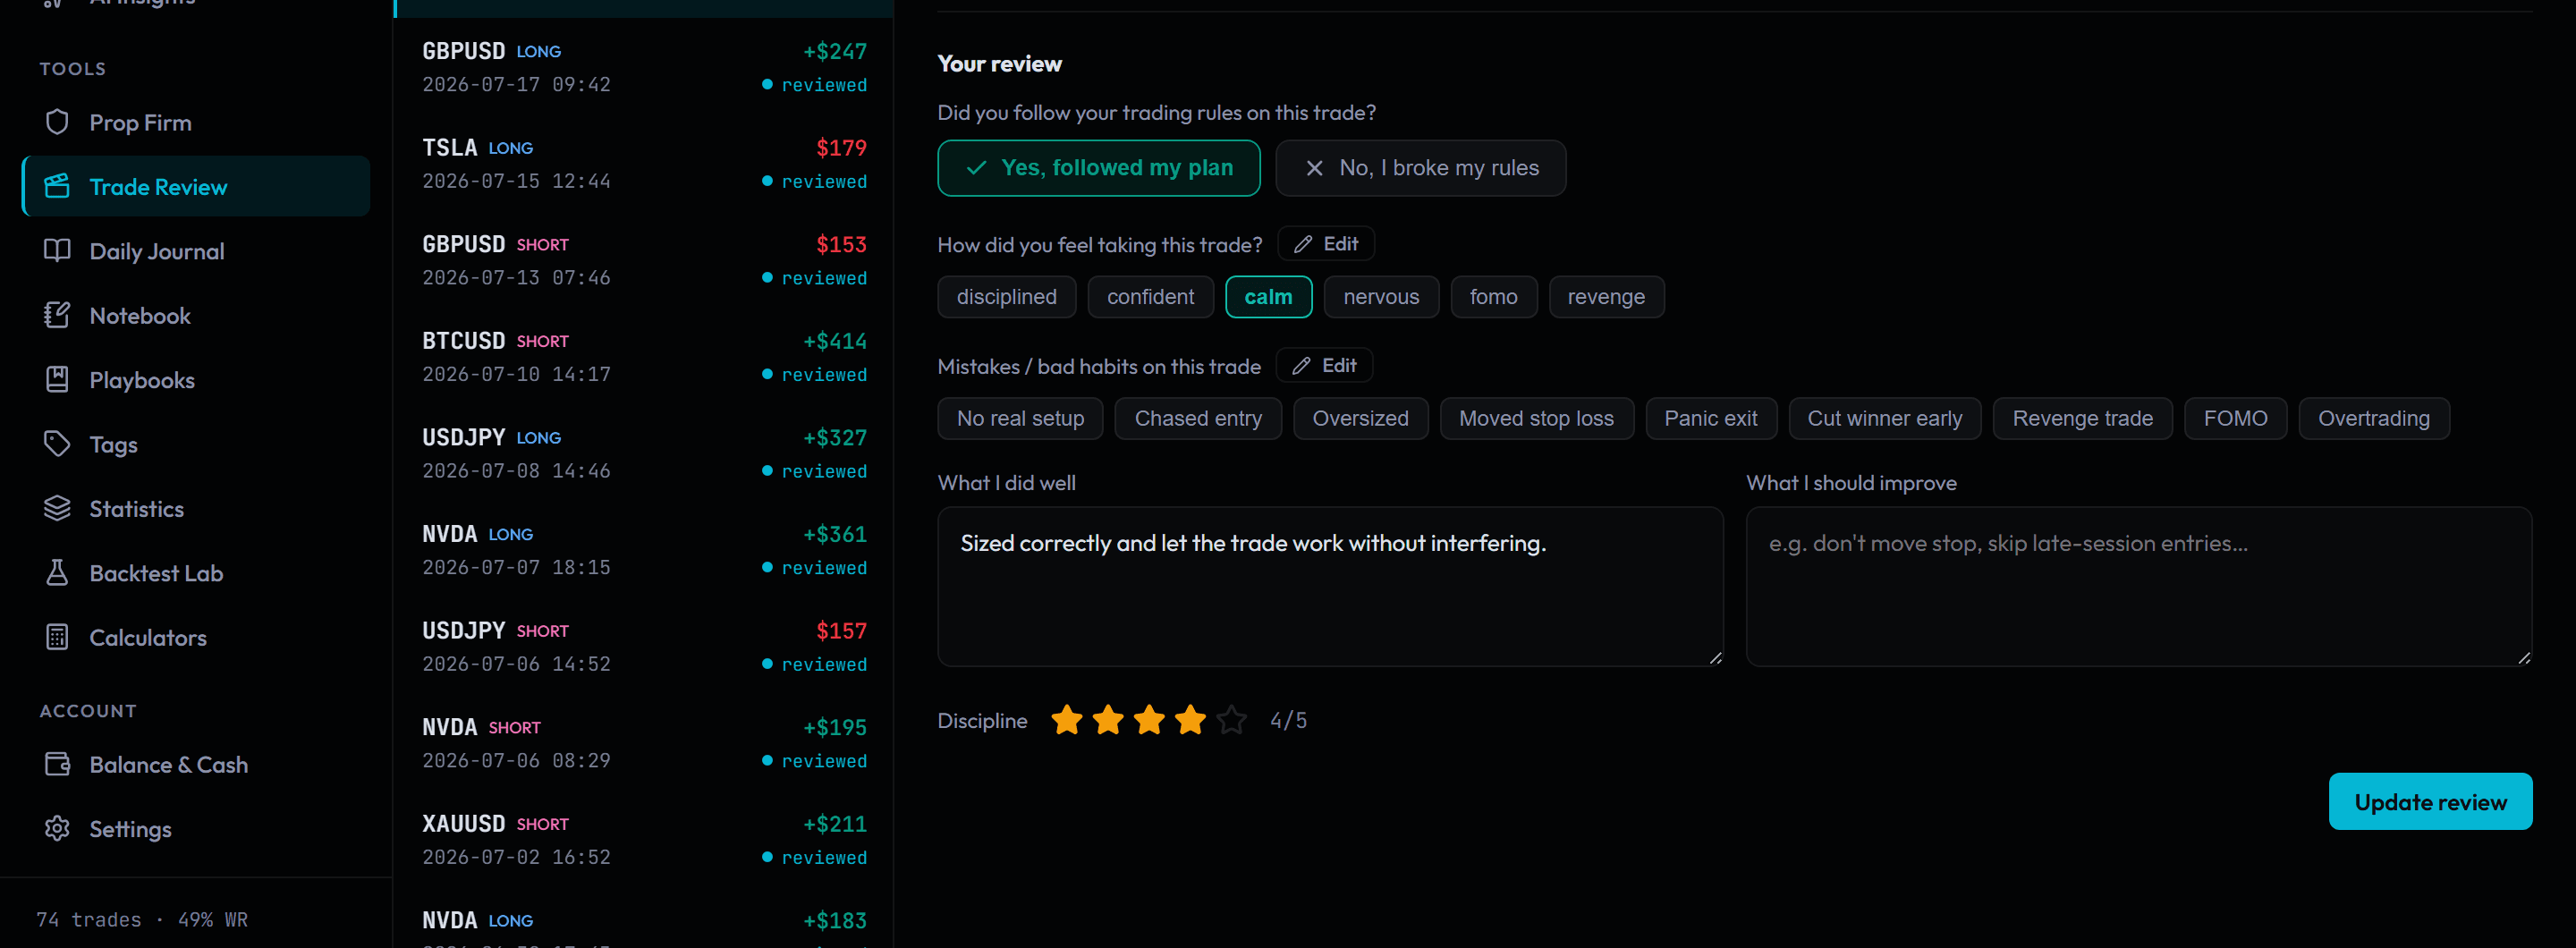
Replay the trade, then be honest about it.
Step back through any closed trade candle by candle and watch what price actually did while you were in it. Then record how you felt, what you got right, and which rule you broke. That last part is the bit most journals skip, and it's what the discipline score and the AI coach read from.
- Candle-by-candle replay of any closed trade
- How much you left on the table, and how much heat you took
- Emotion and mistake tagging, with a 1–5 discipline rating
- Flags habits automatically before you even fill it in
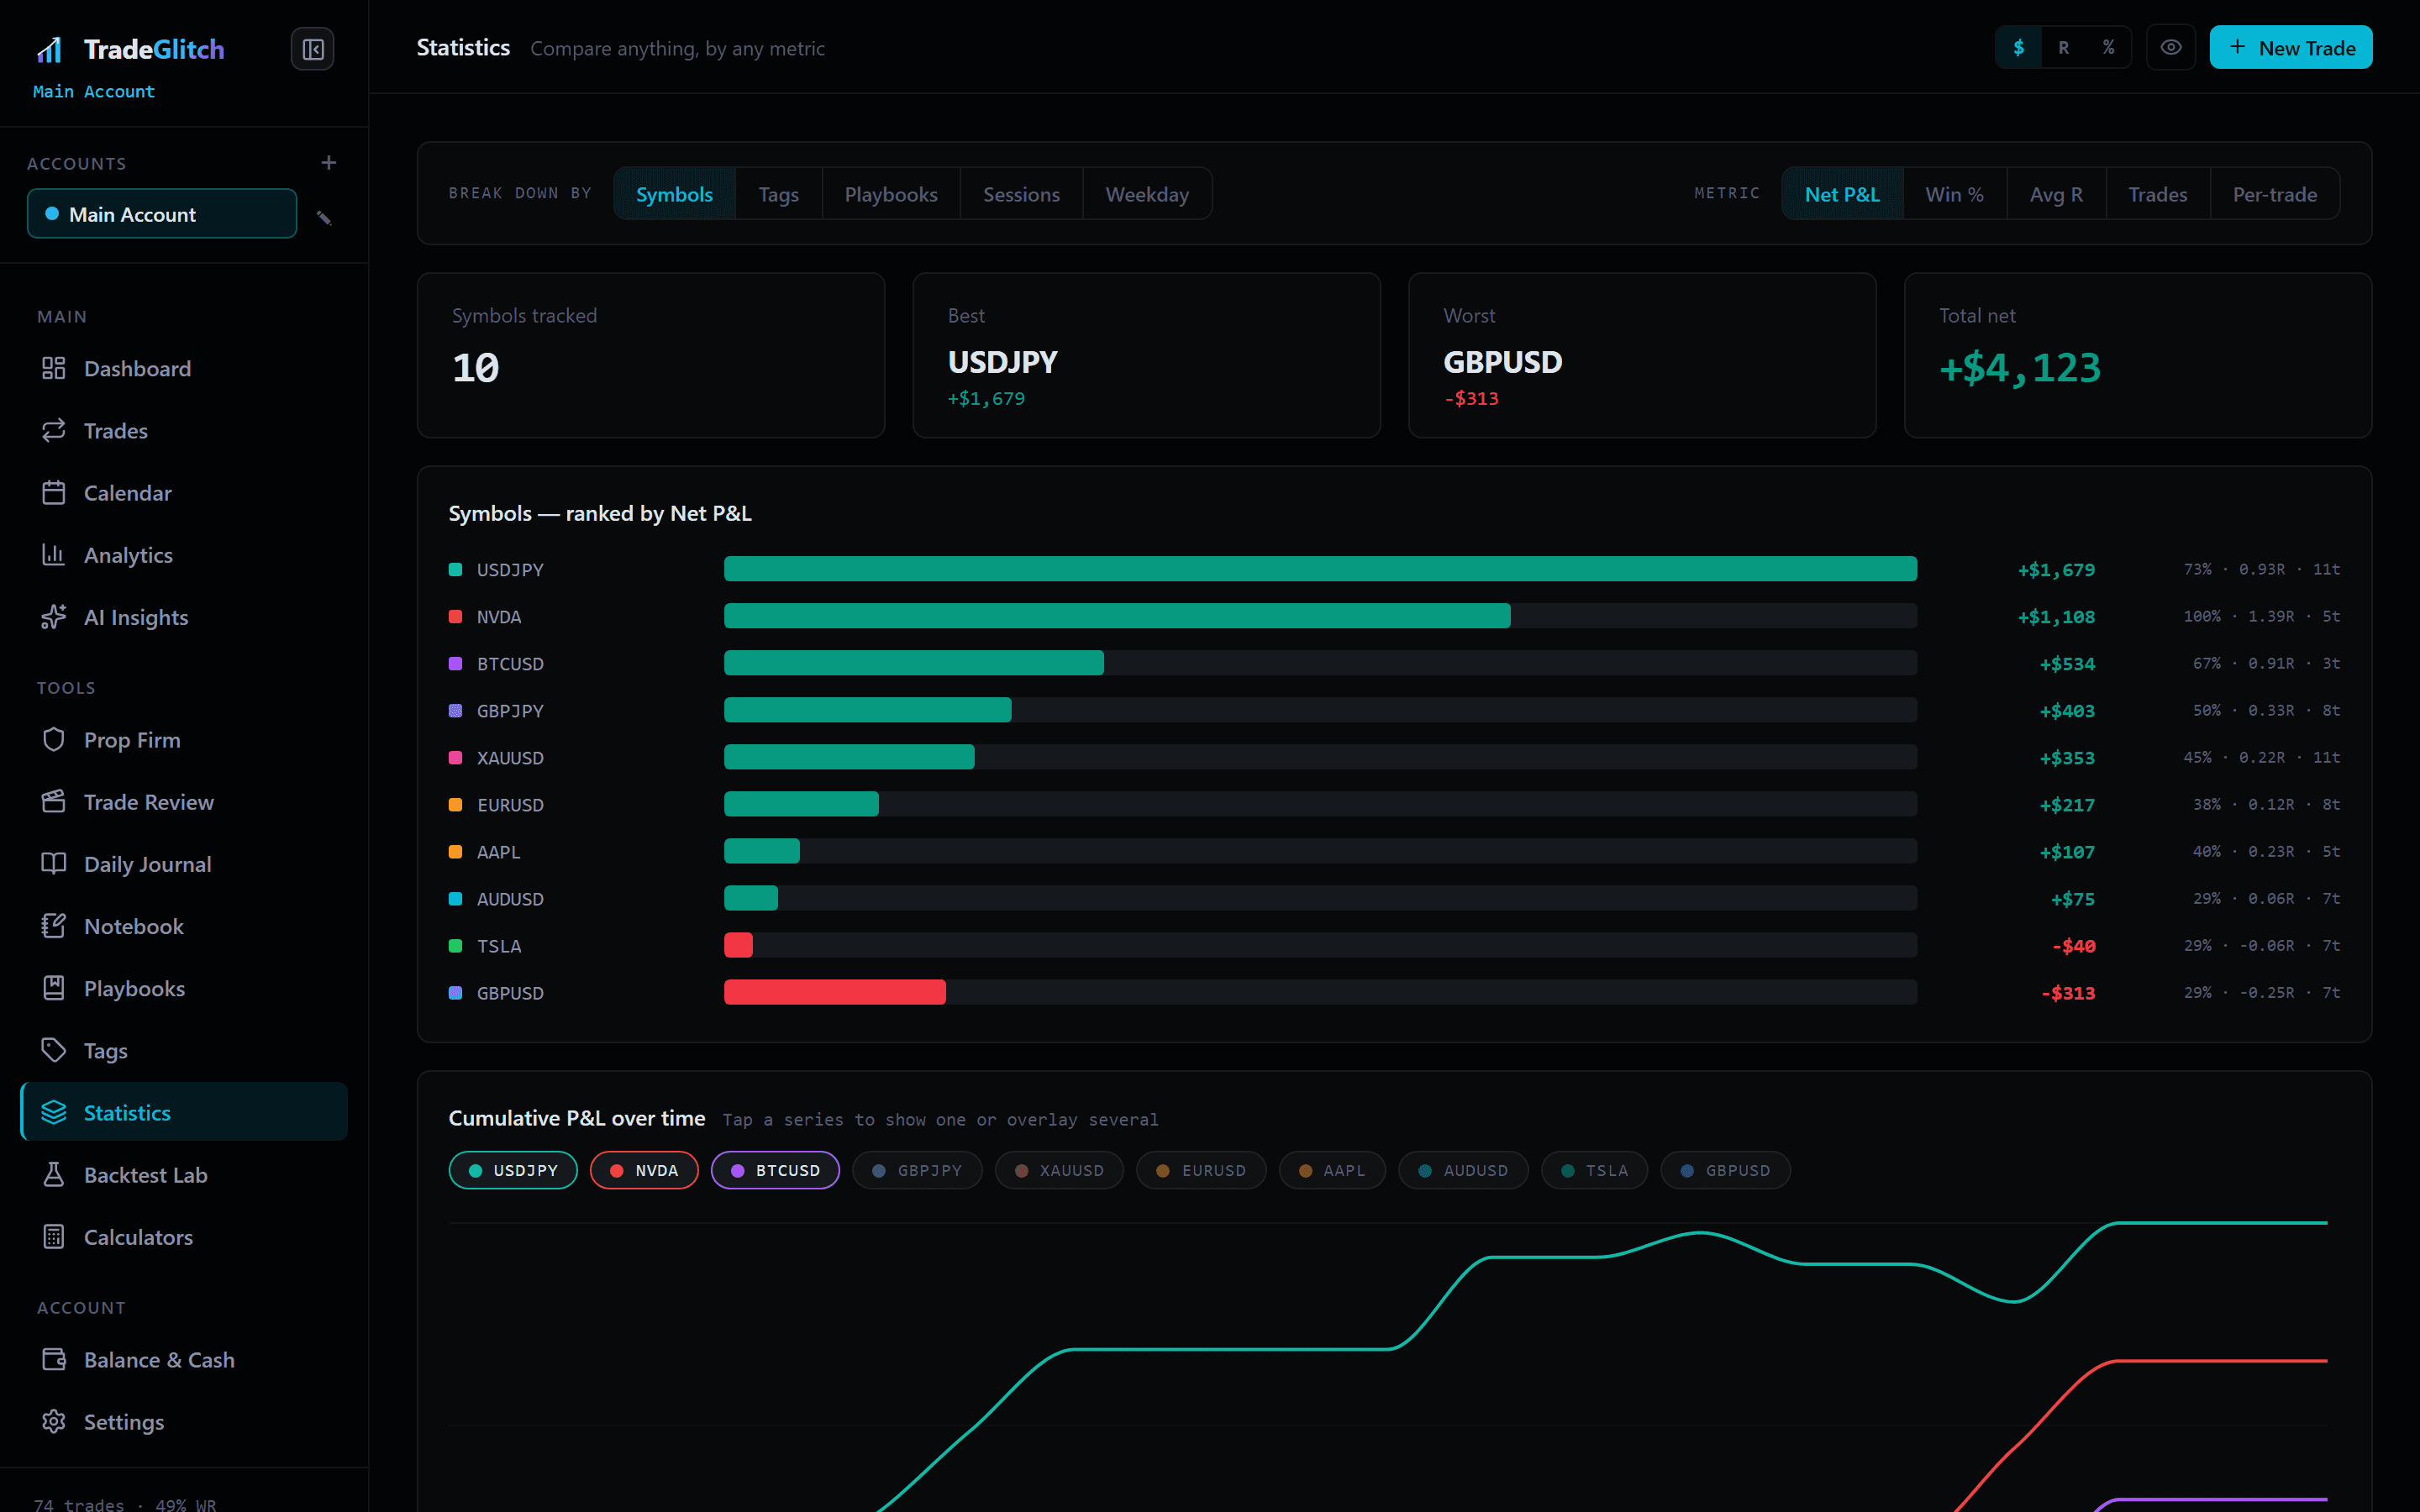
Compare anything, measured any way.
Pick what to split your history by — symbol, tag, playbook, session, weekday — and pick what to measure it on: net P&L, win rate, average R, or return per trade. The answer comes back as a ranked chart and a table you can read in about five seconds.
- Five ways to break it down, crossed with five ways to measure it
- Ranked bars, overlay chart and a side-by-side table
- Spot the setup that looks good on win rate and loses money on R
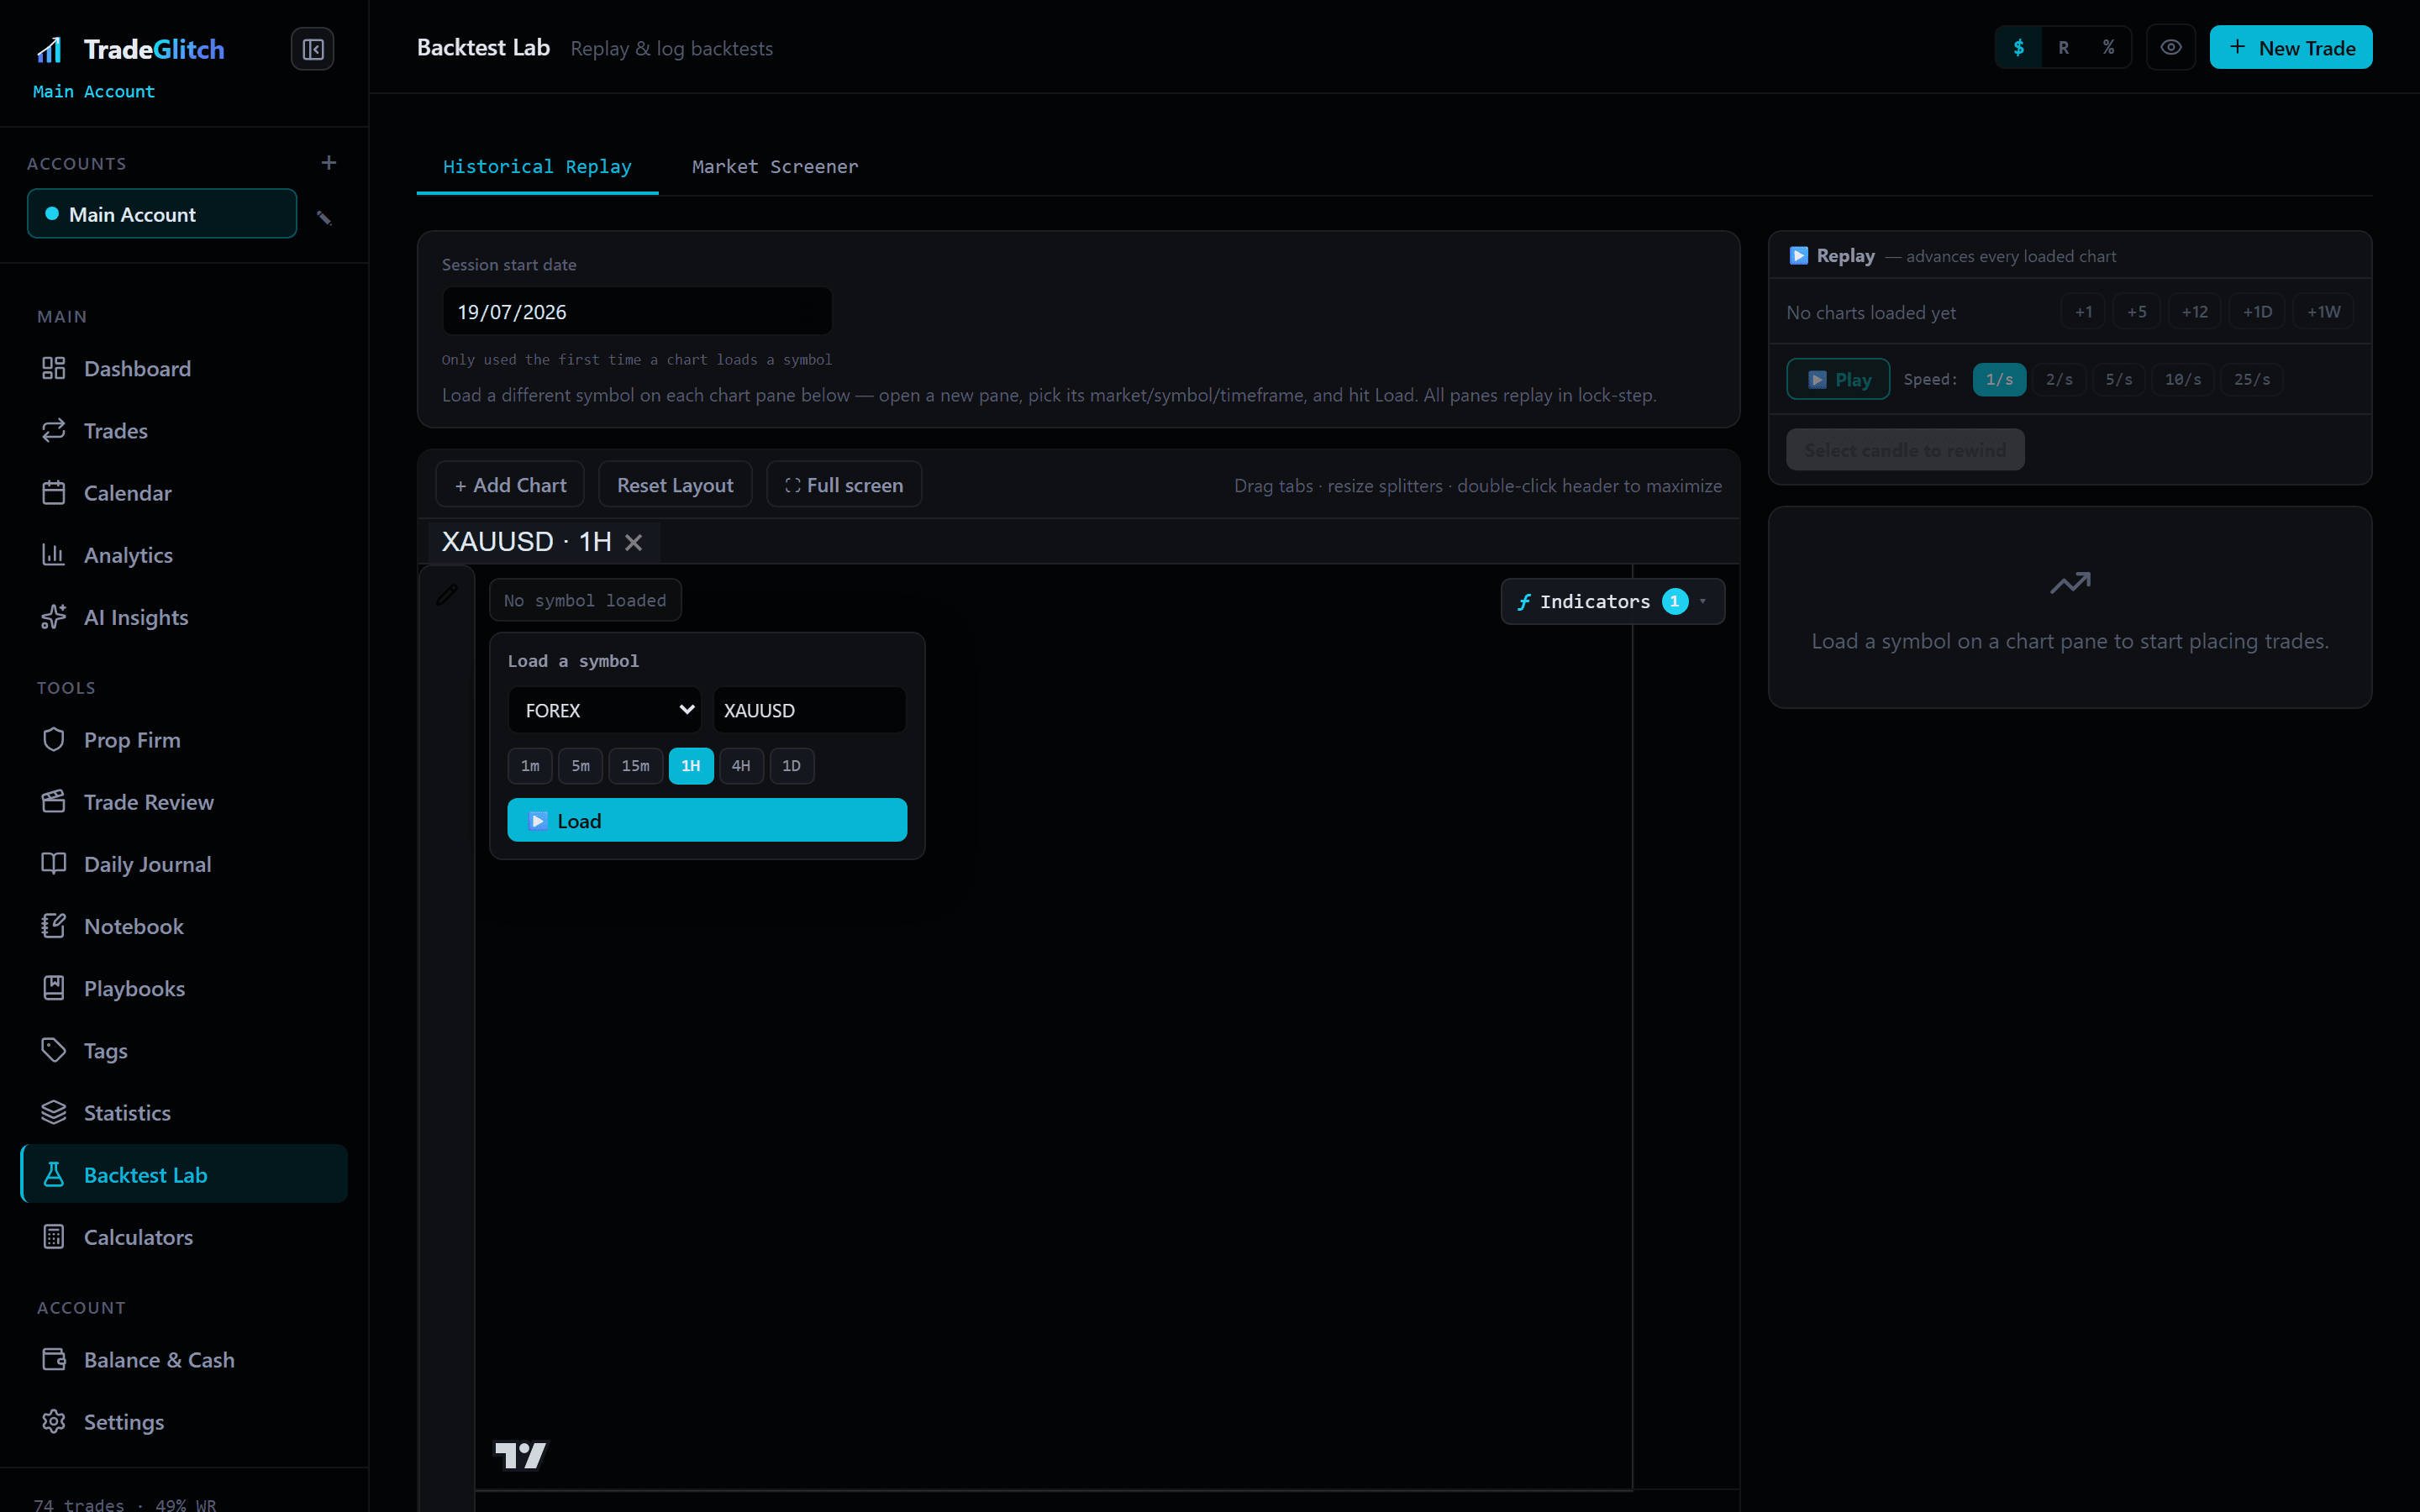
Practise the setup without paying to learn it.
Replay historical price bar by bar across several charts at once, and log trades against the replay exactly as you would live. It's how you get reps on a setup — and build a record of whether it actually works — before any real money is involved.
- Multiple charts replaying in lock-step, each on its own symbol and timeframe
- Adjustable speed, and start from any date you like
- Log trades against replayed price, kept separate from your live results
- Built-in screener for finding candidates
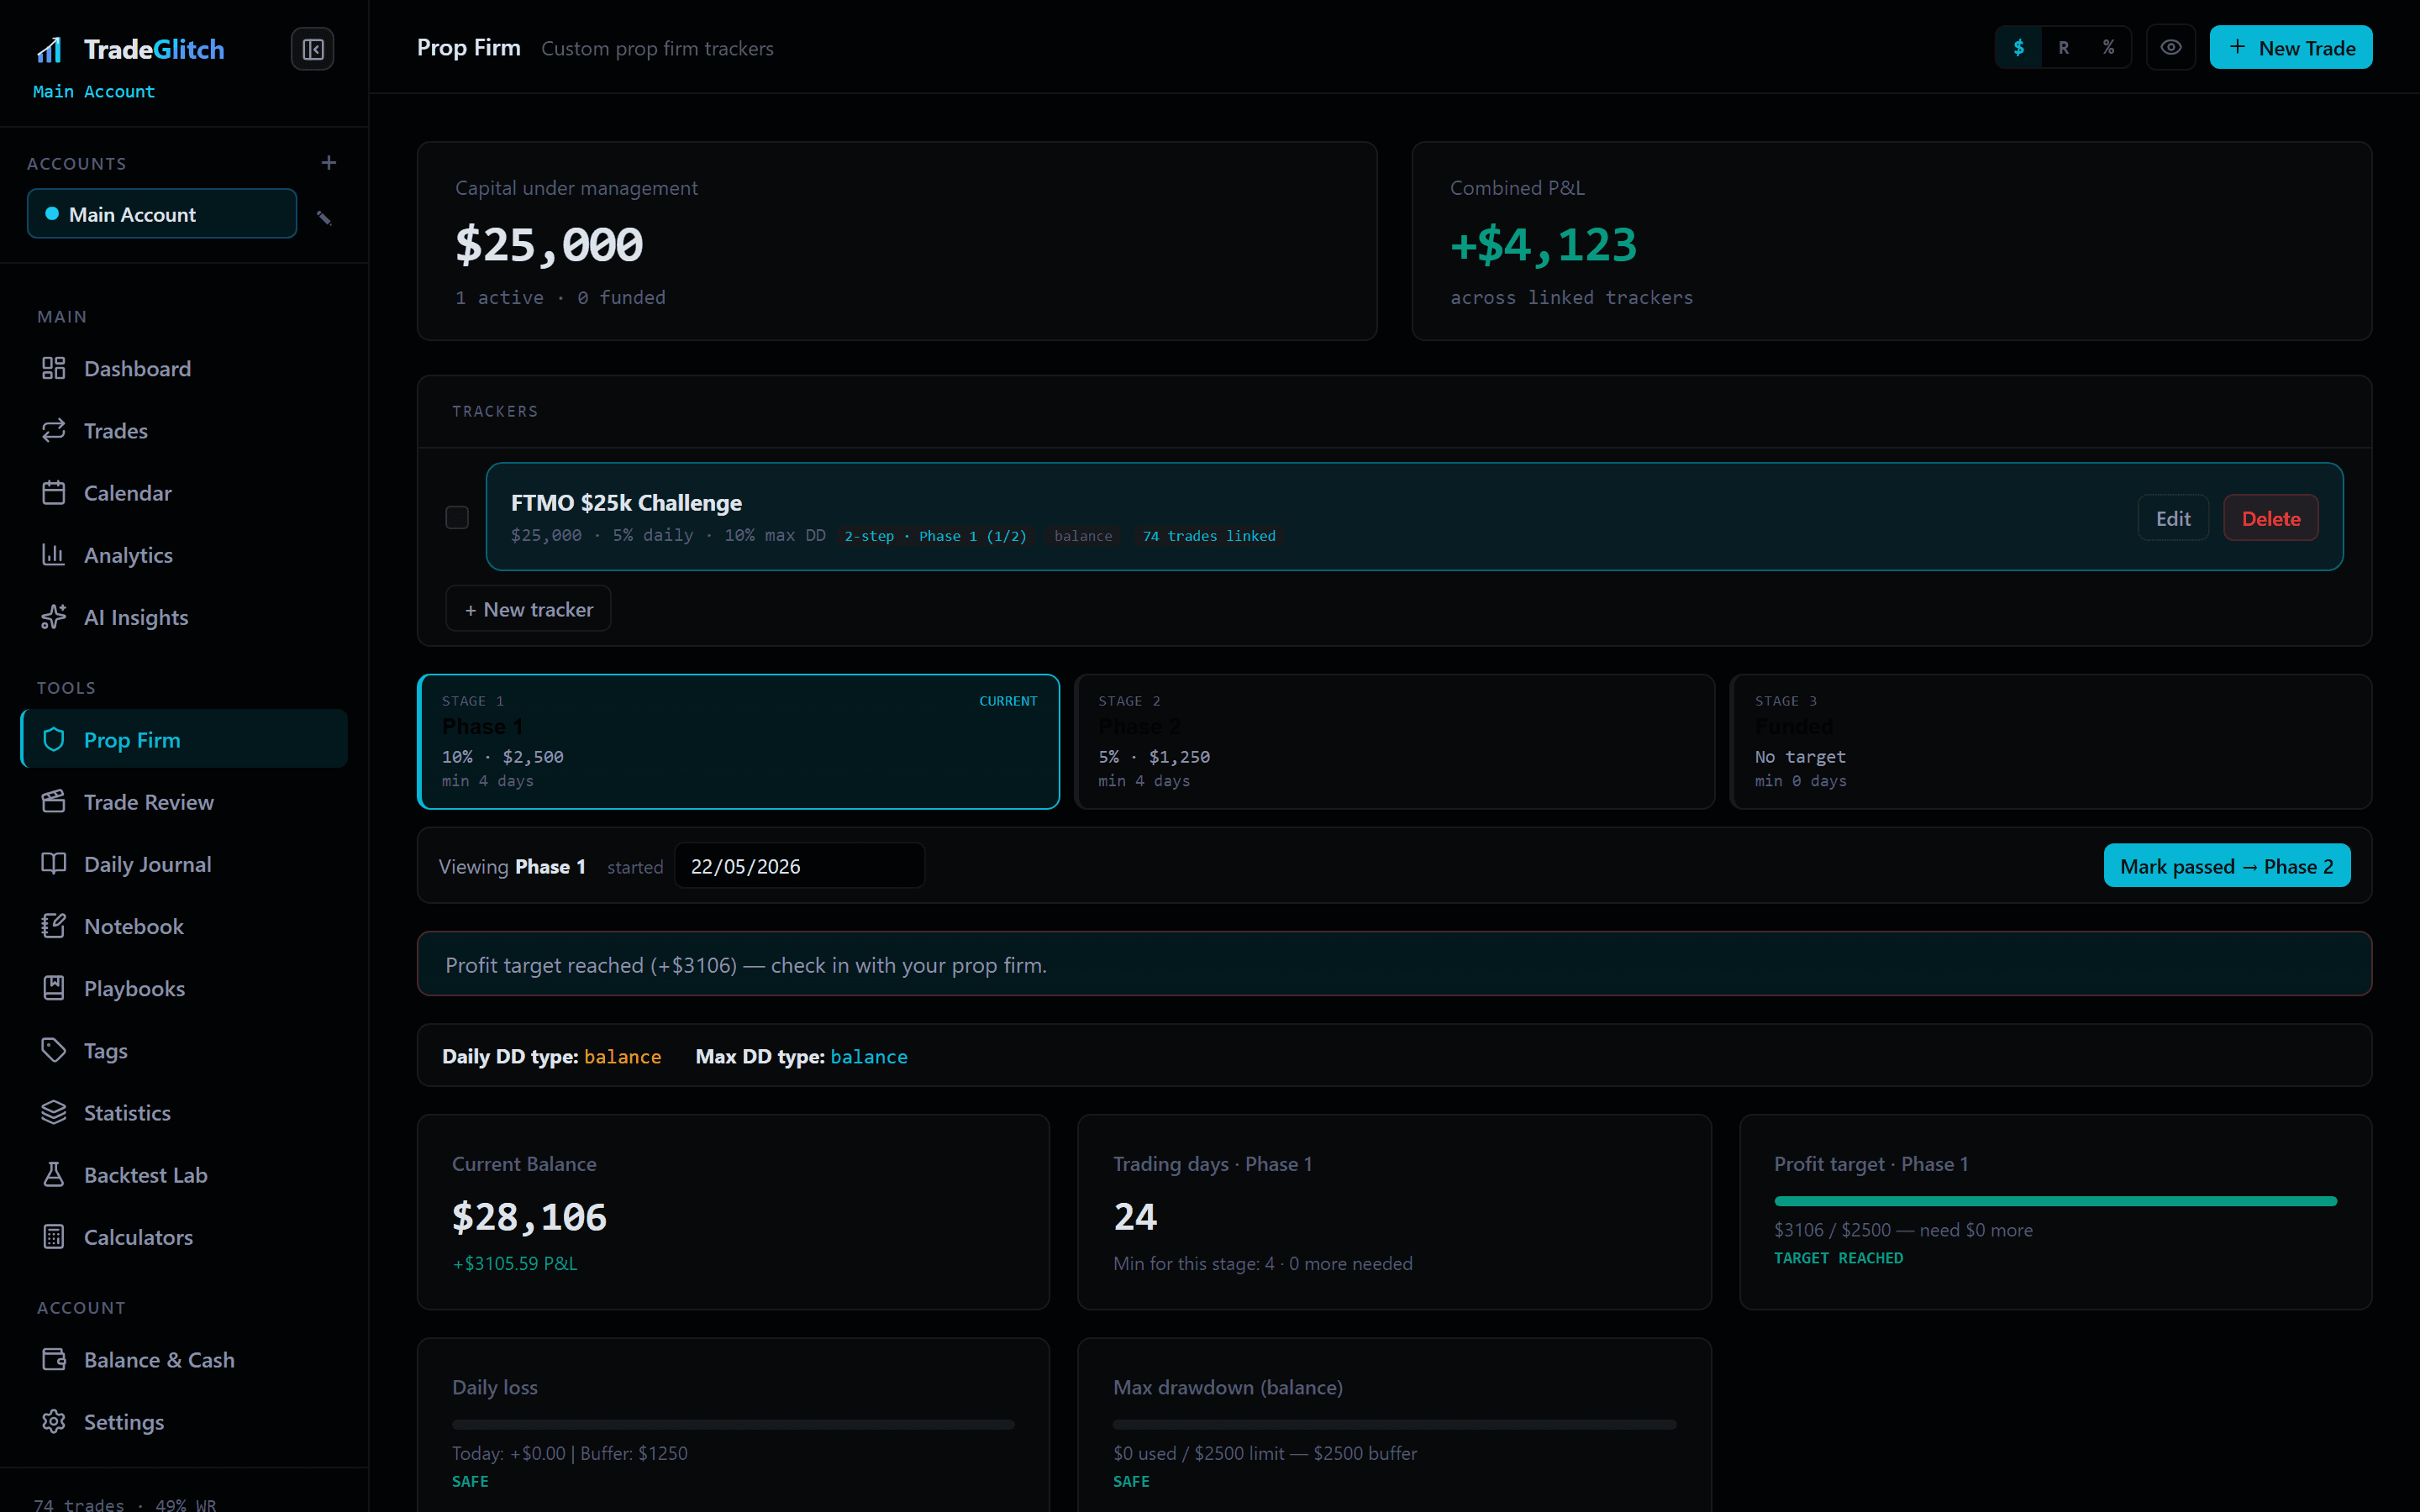
See the rule you're about to break, before you break it.
Set your firm's drawdown limit, daily loss cap and profit target once, and watch how close you are to each in real time. Most challenges are failed by a rule the trader forgot was there, not by bad trading.
- Custom trackers for any firm and any rule set
- Live drawdown and daily loss against your limits
- Multiple challenges tracked side by side
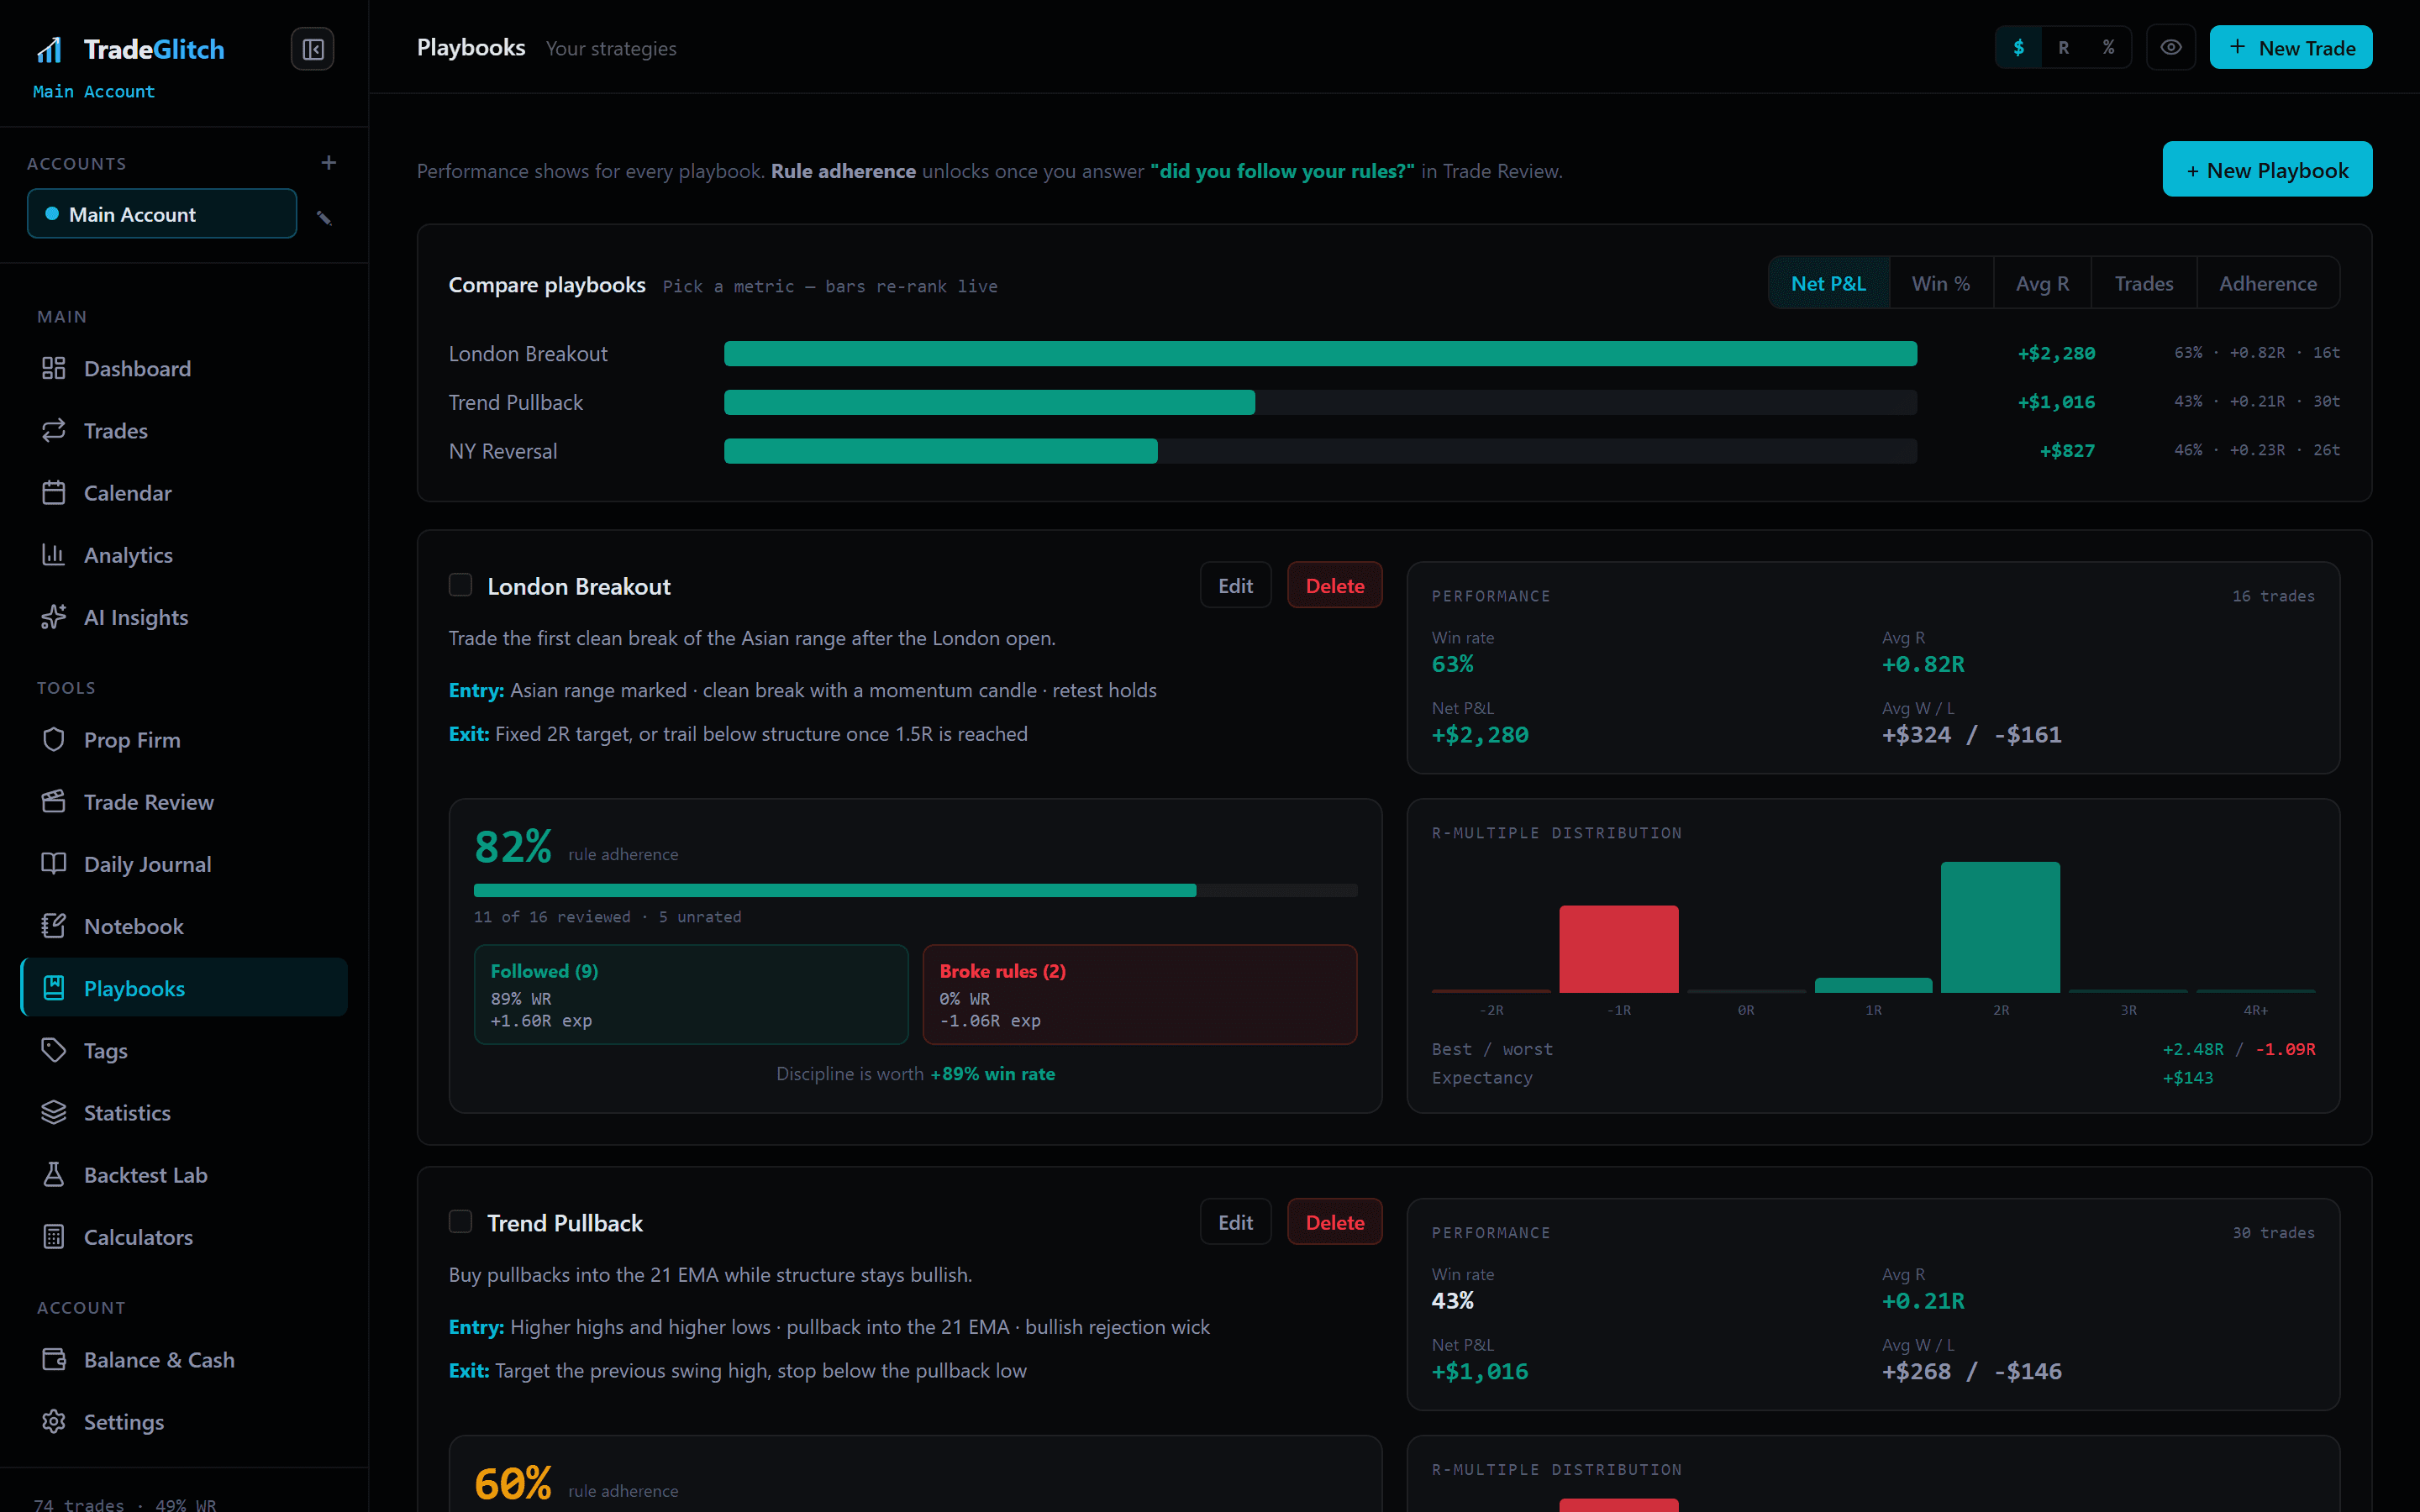
Write the setup down, then find out if it works.
Document what a setup requires — conditions, entry trigger, invalidation, target — and tag every trade to it. After thirty trades you stop guessing which of your setups is carrying you and which one only feels good.
- Reusable templates for each setup you trade
- Tag a trade to one playbook or several
- Per-playbook win rate, expectancy and R
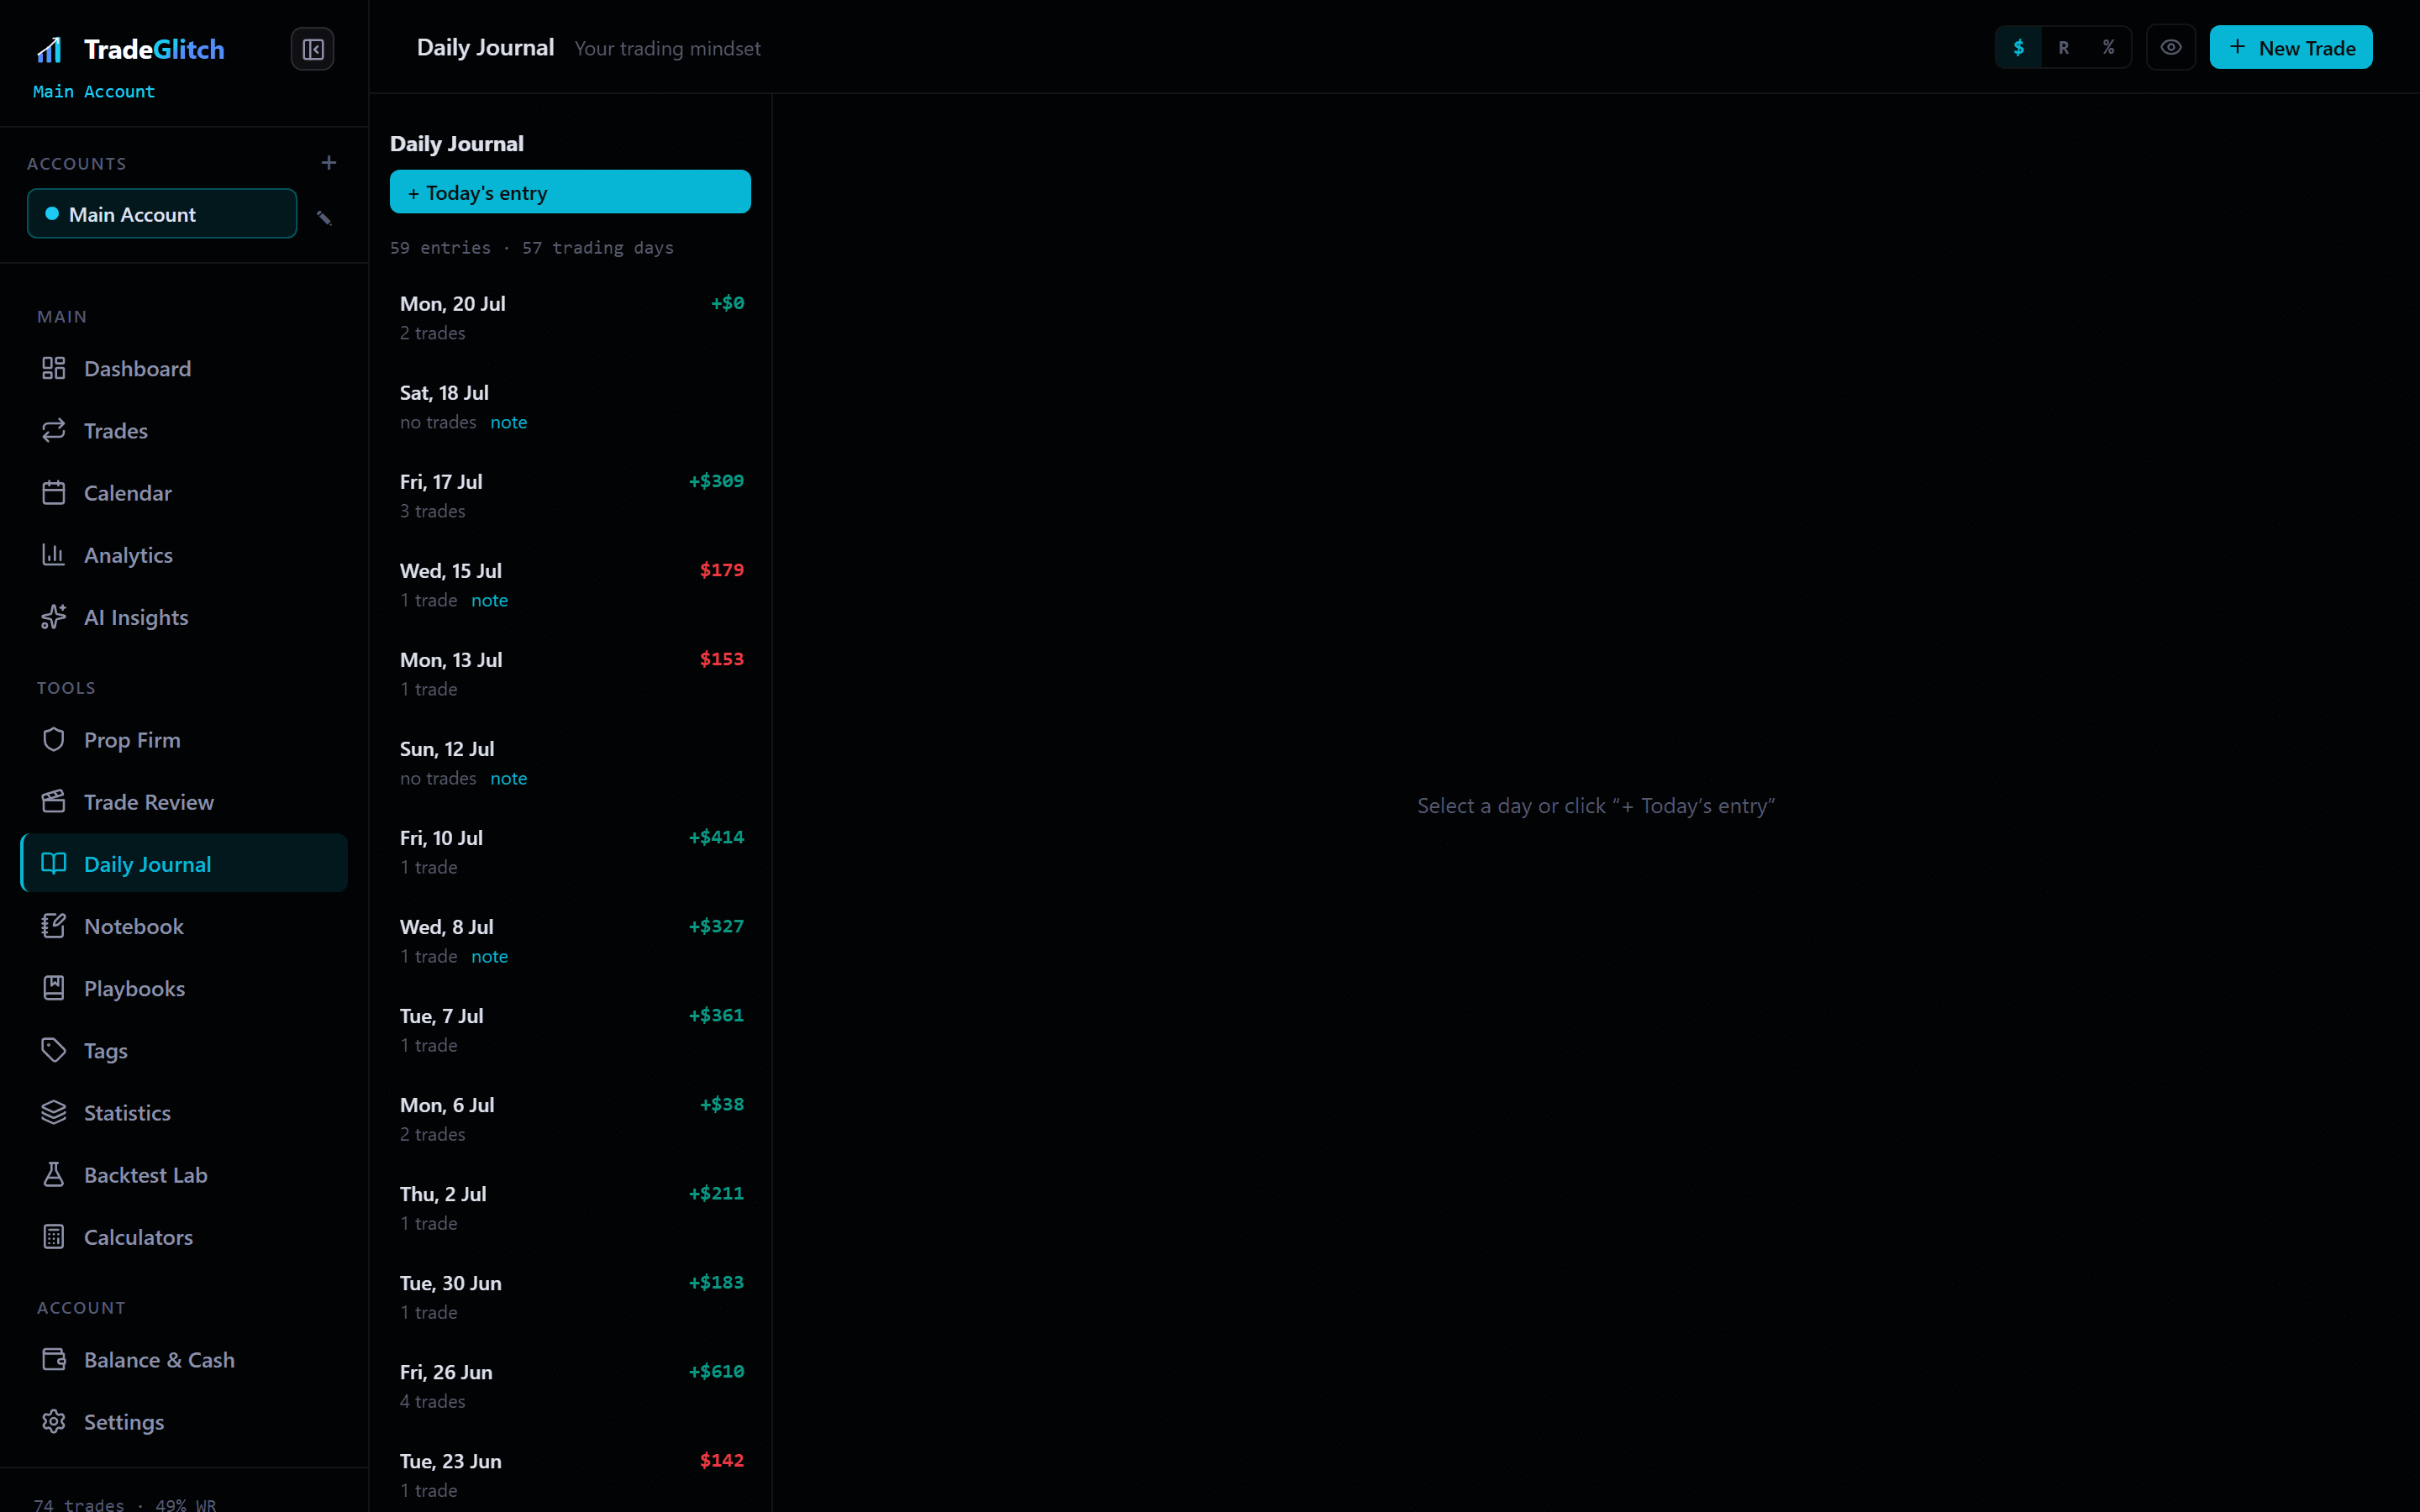
One page per trading day.
The day's trades, P&L and win rate next to your own notes on how you actually traded — including your state of mind. Patterns in your behaviour end up as visible as patterns in your P&L, which is usually where the money is.
- Per-day trades, win rate, gross P&L and fees
- Full trade detail inline — entry, exit, stop, target, hold time, tags
- Daily notes with mindset tags: disciplined, calm, FOMO, revenge
The rest of the toolkit, in the same place.
No add-ons, no upsells for the basics. All of this is in every plan, including the trial.
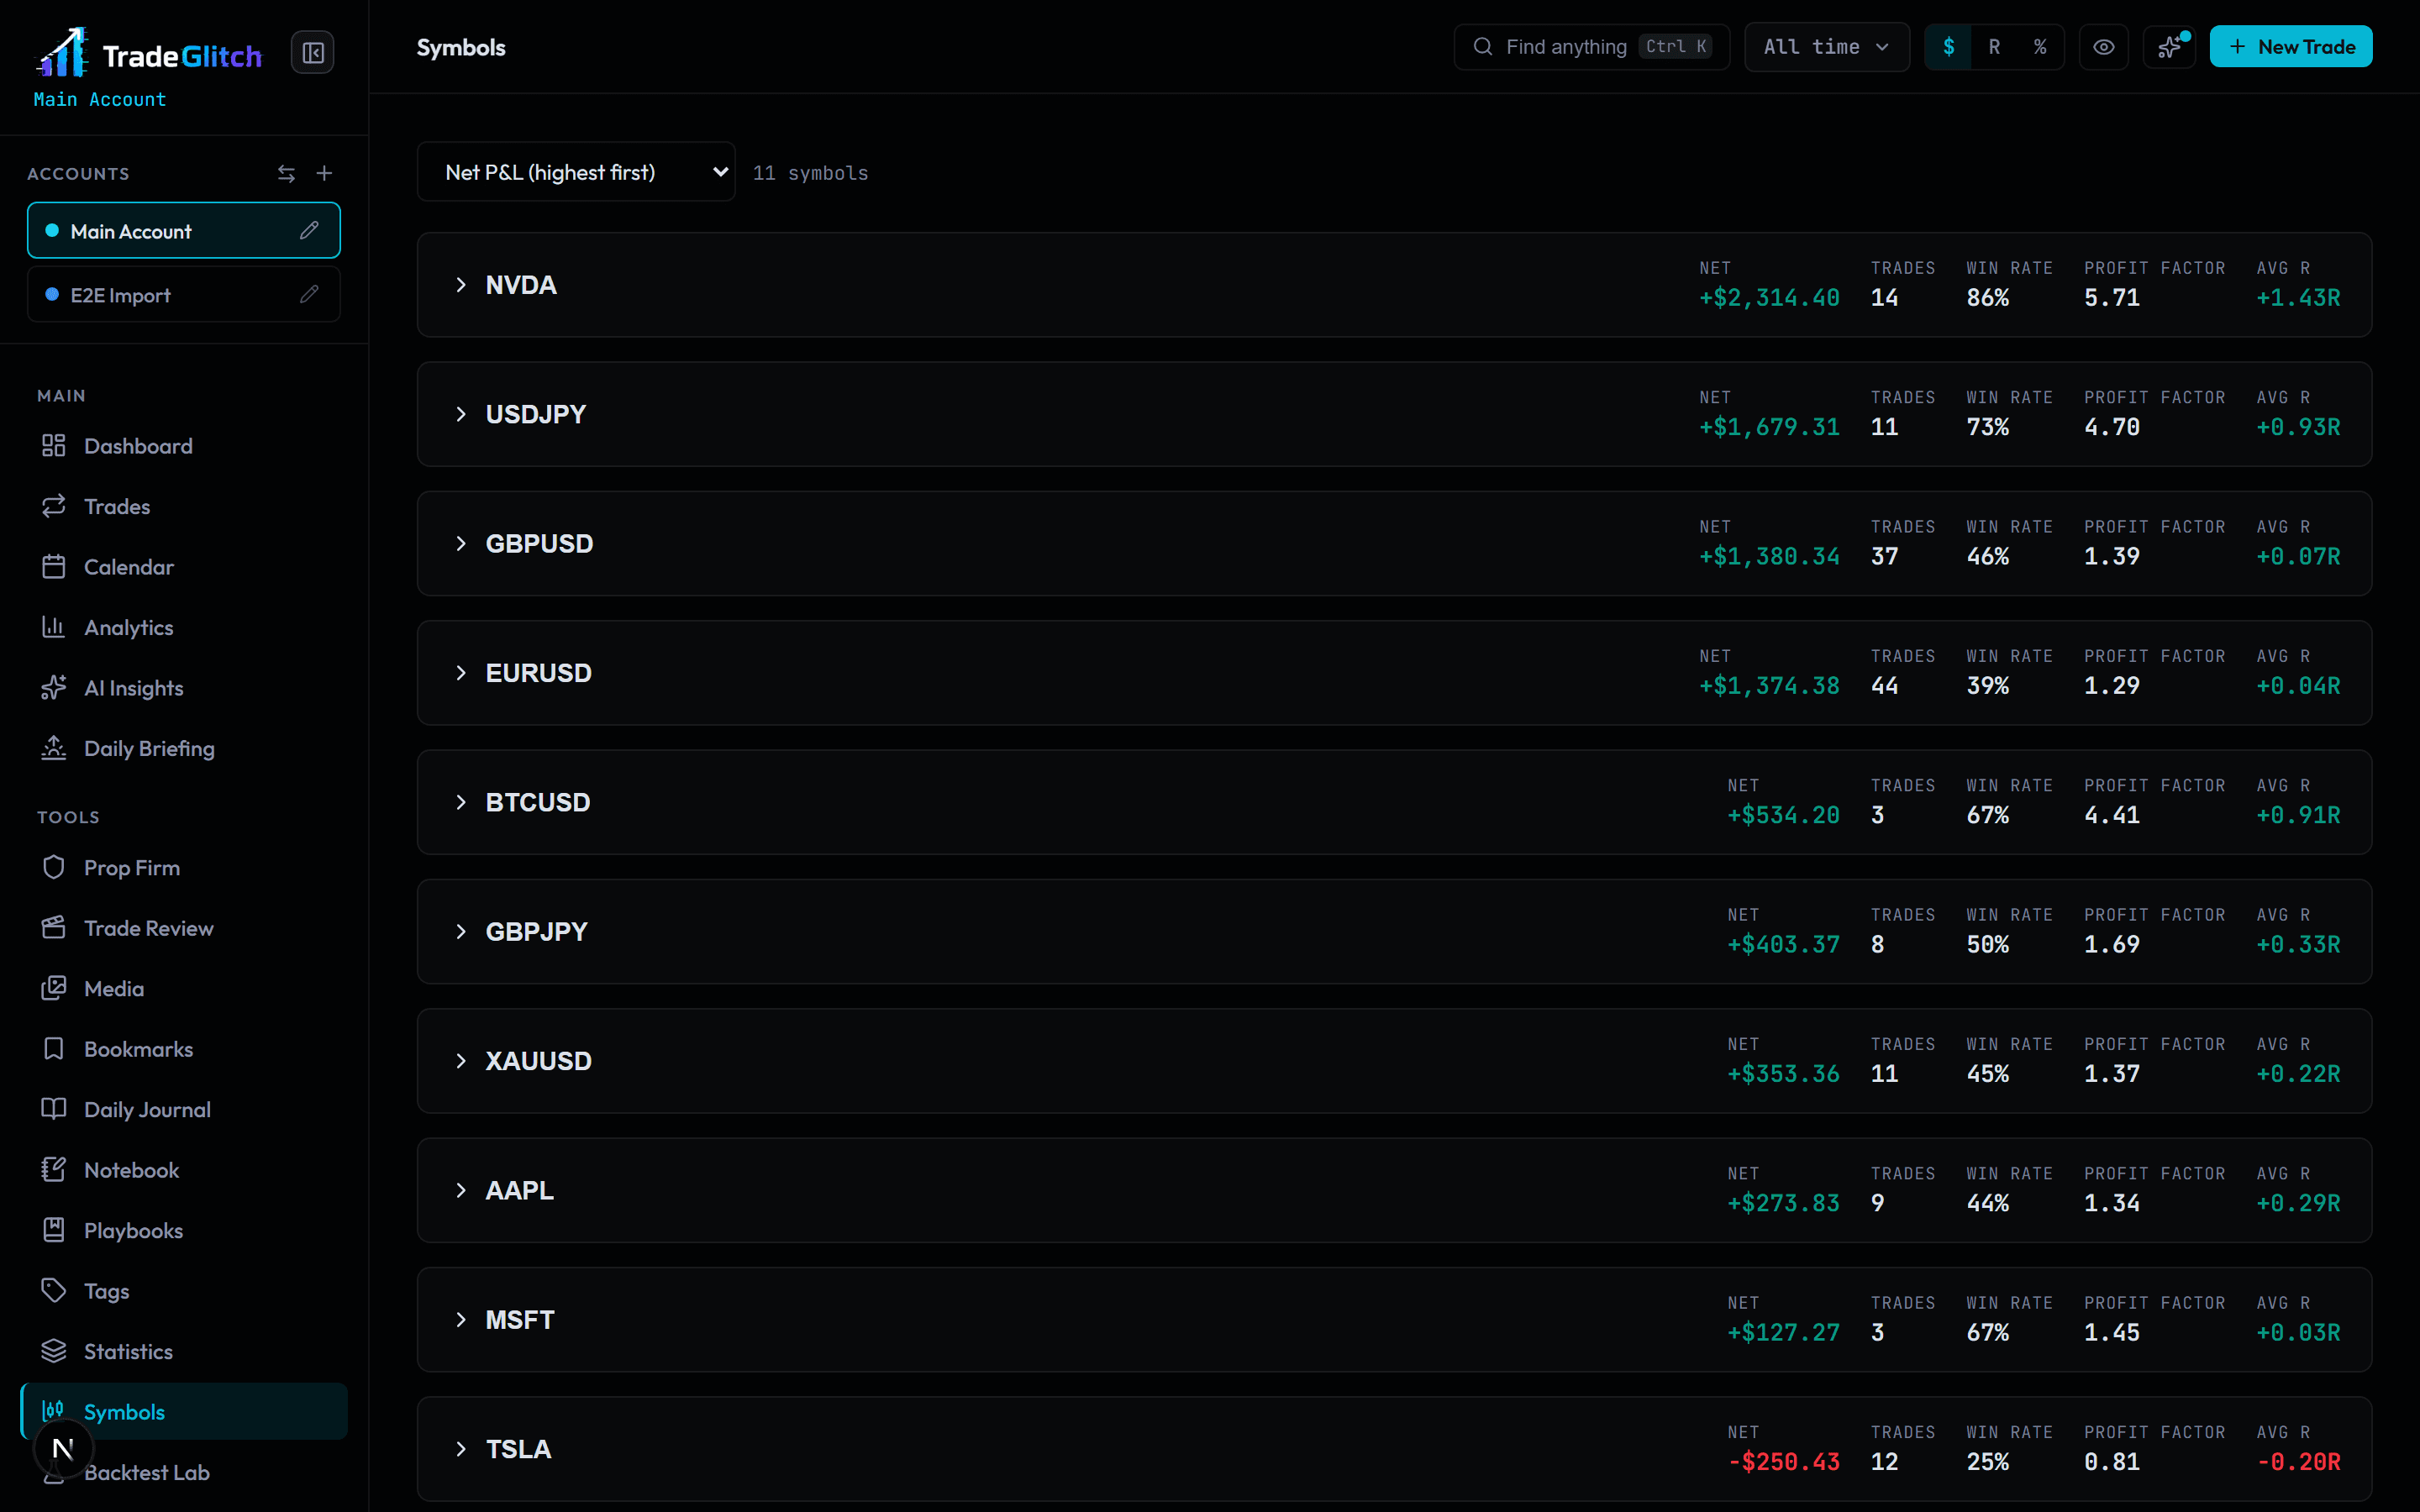
Symbols
Every instrument you've traded, with your record on each one. Some traders find out here that two symbols account for most of their losses.
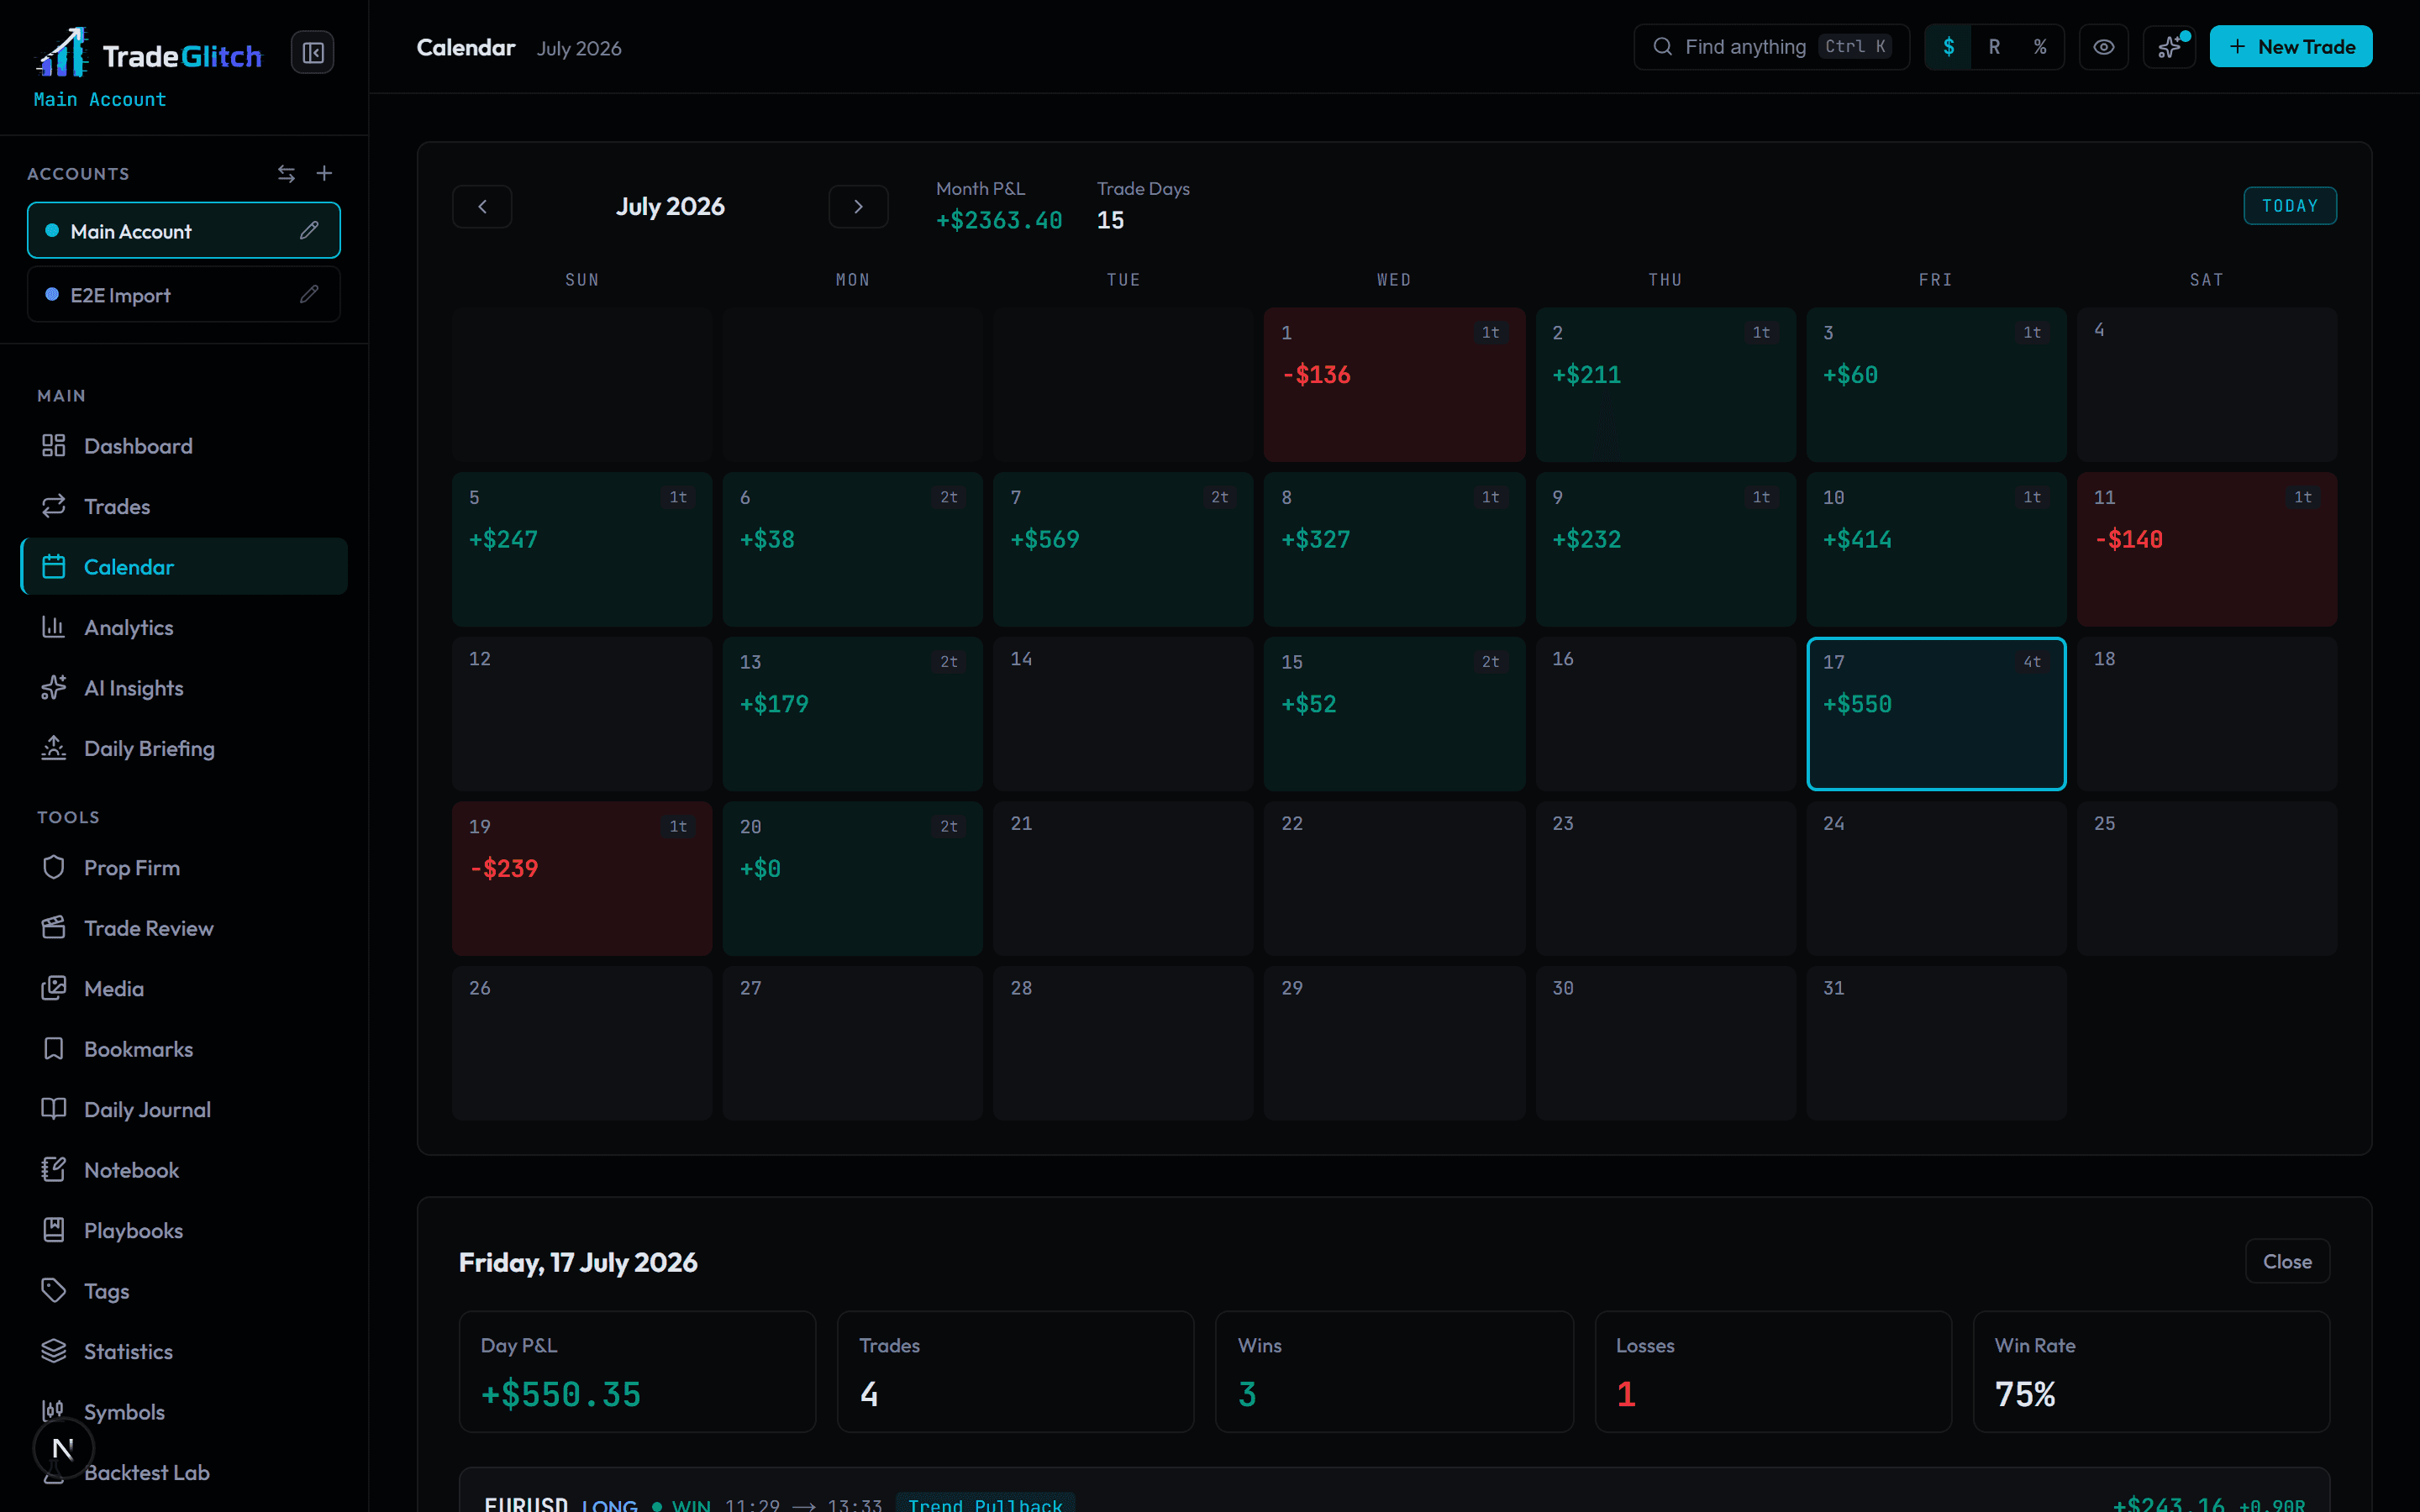
Calendar
Every trading day coloured by what it made or lost, with the day's trades one click away. The fastest way to find the week things went wrong.
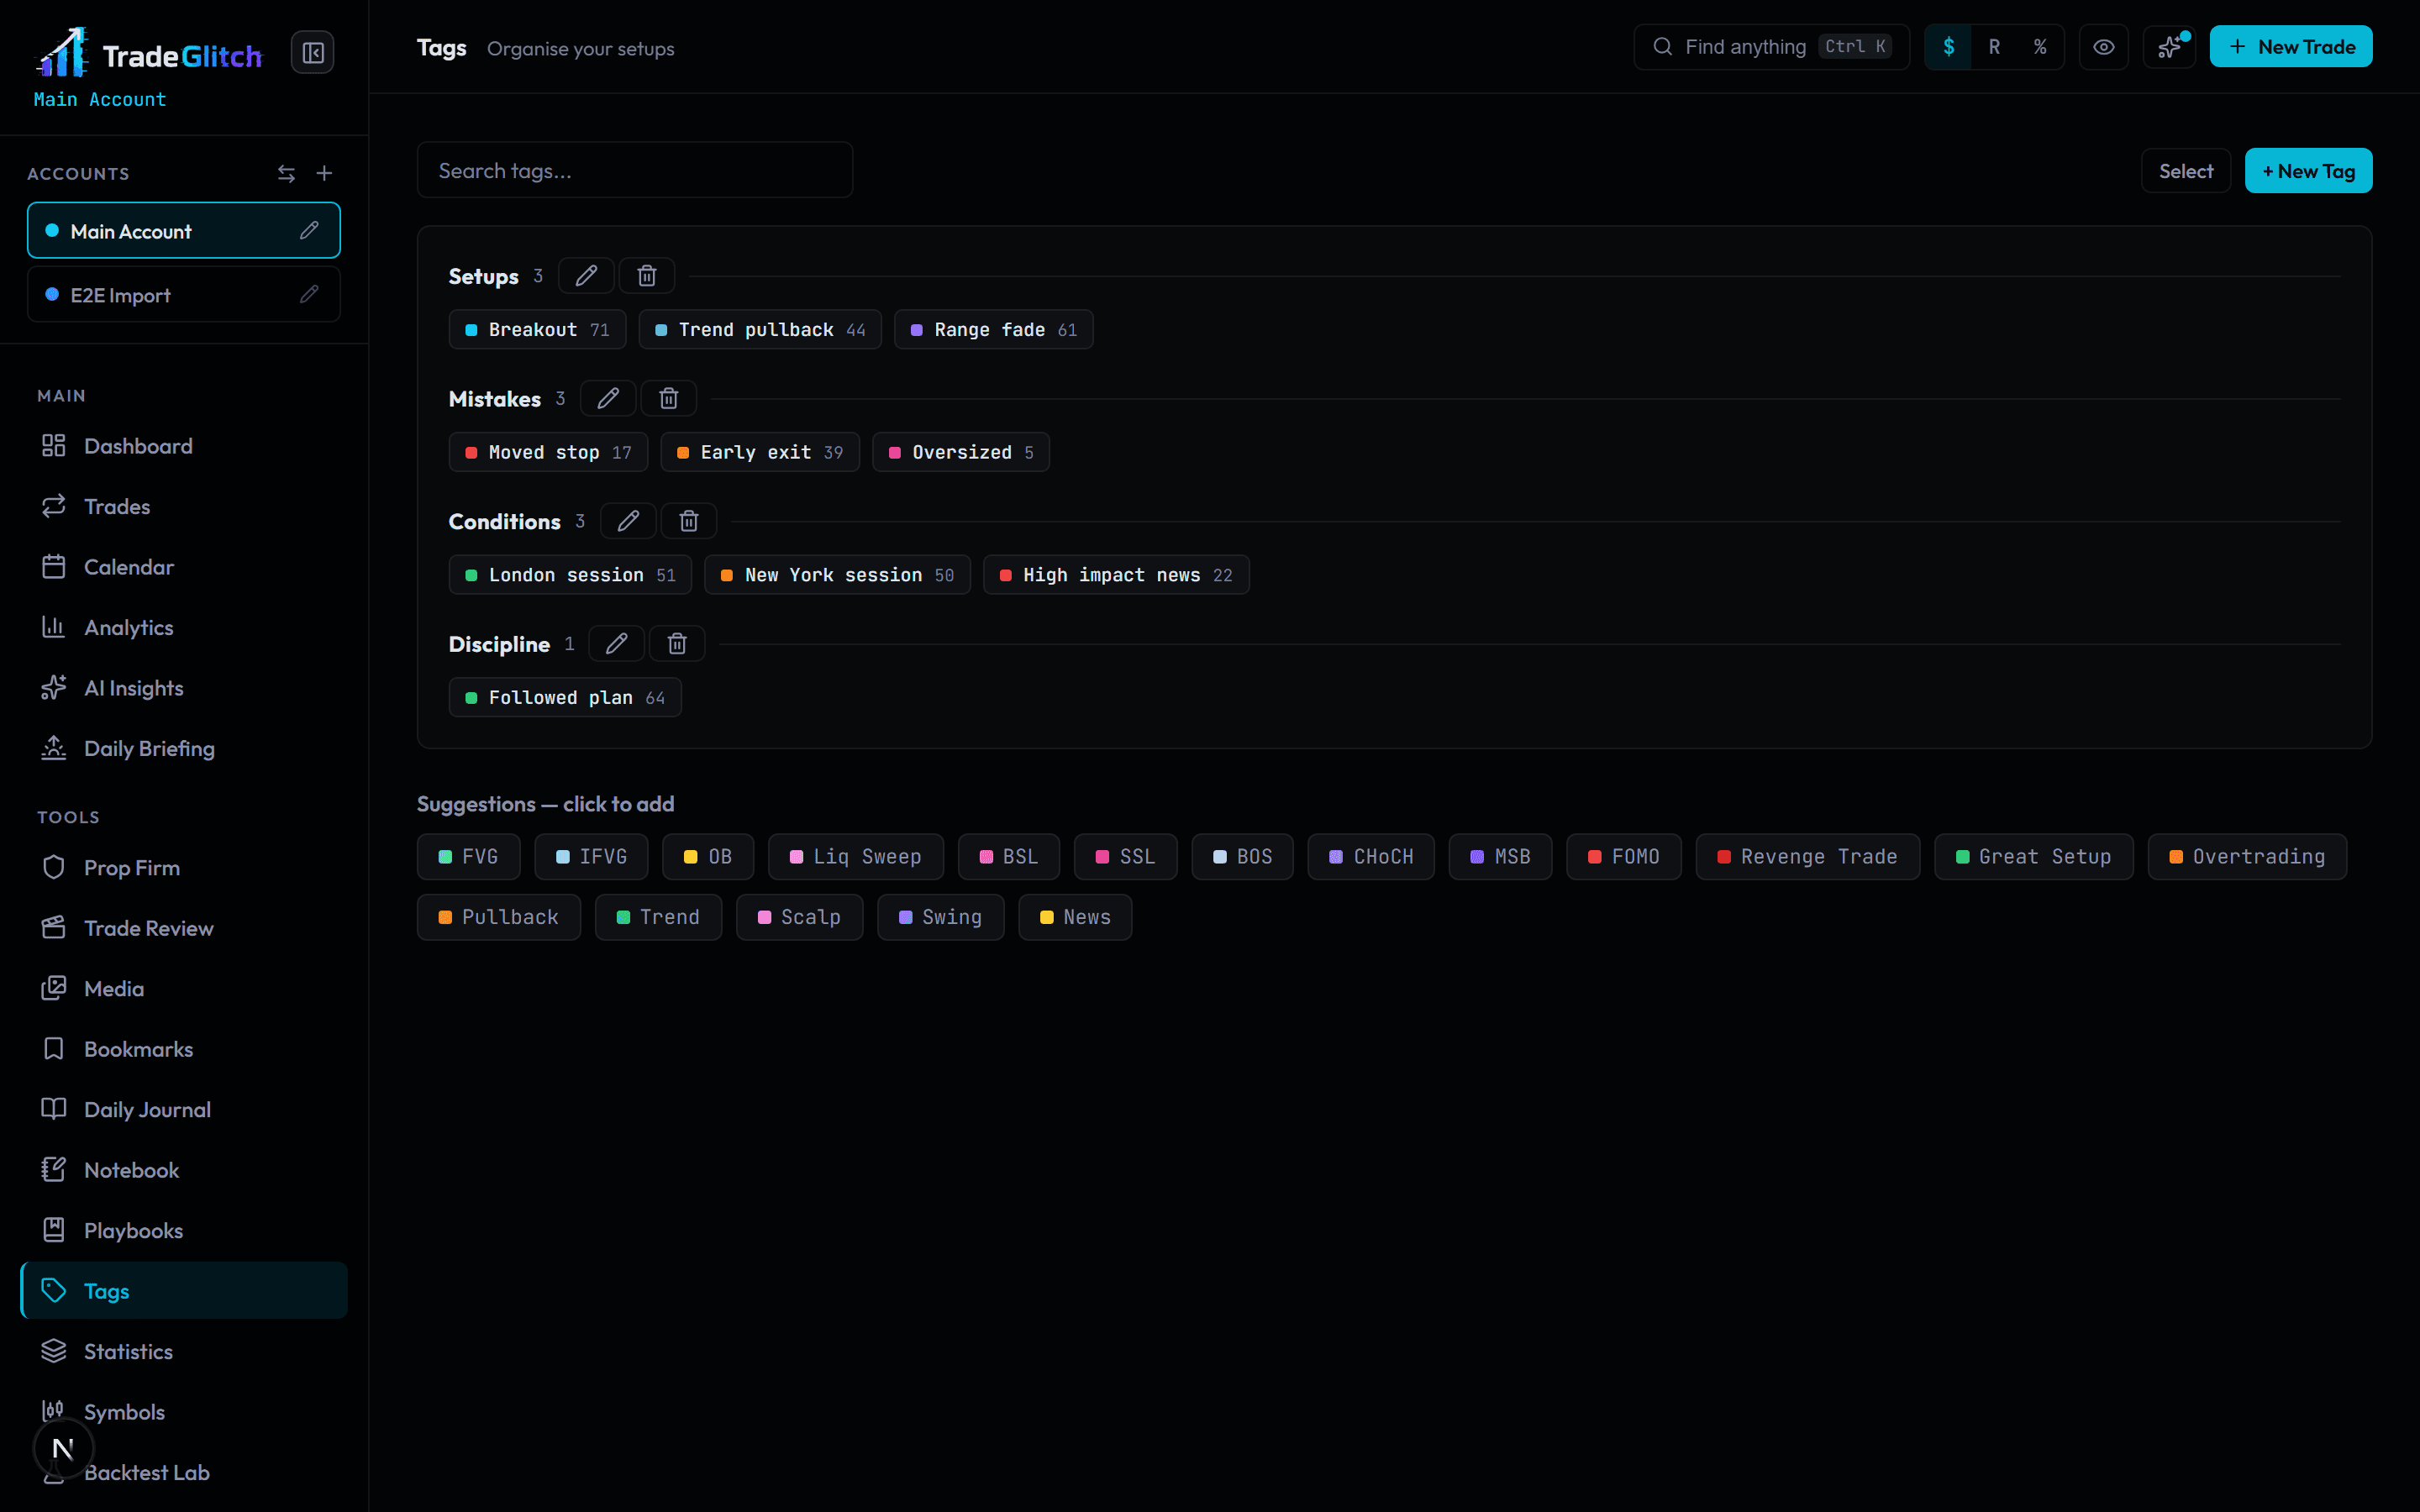
Tags
Name your setups, conditions and mistakes, group them how you think, and cross-reference any tag against any metric. The same tag can mean different things at entry and at exit — so it can live in both.
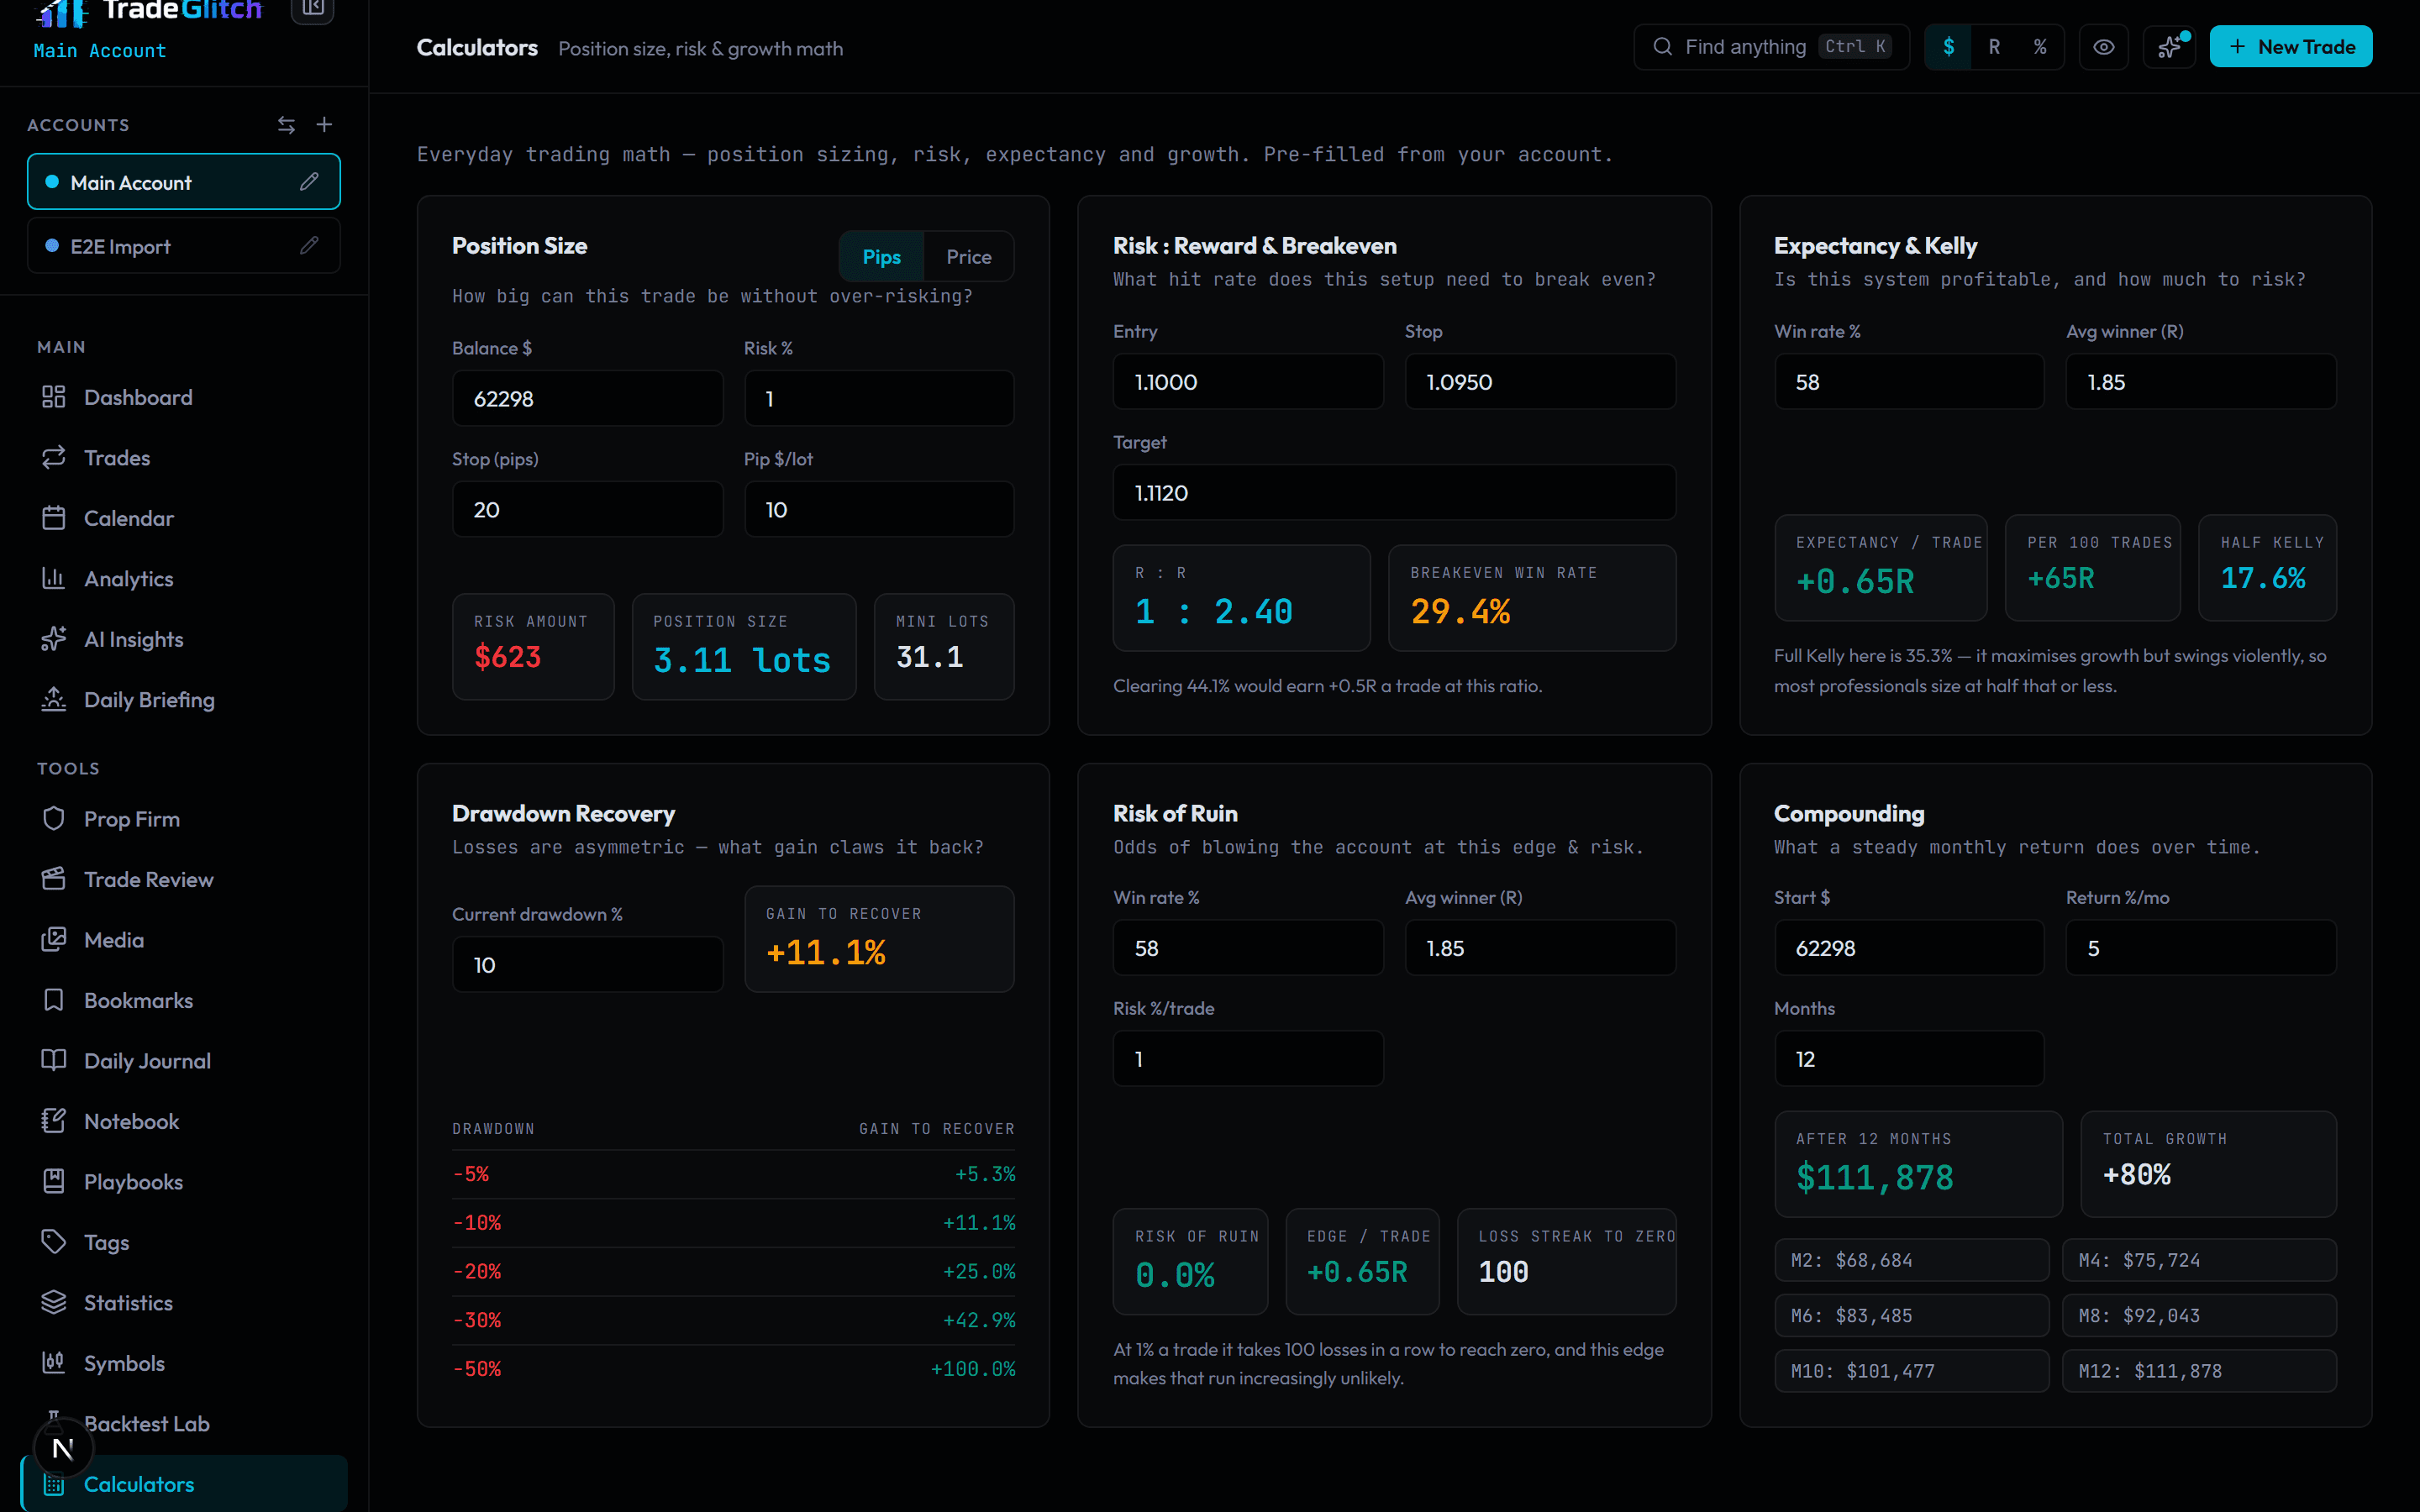
Calculators
Position size, risk:reward, expectancy, drawdown recovery, risk of ruin and compounding — pre-filled from your own account, so the numbers are yours rather than a worked example.
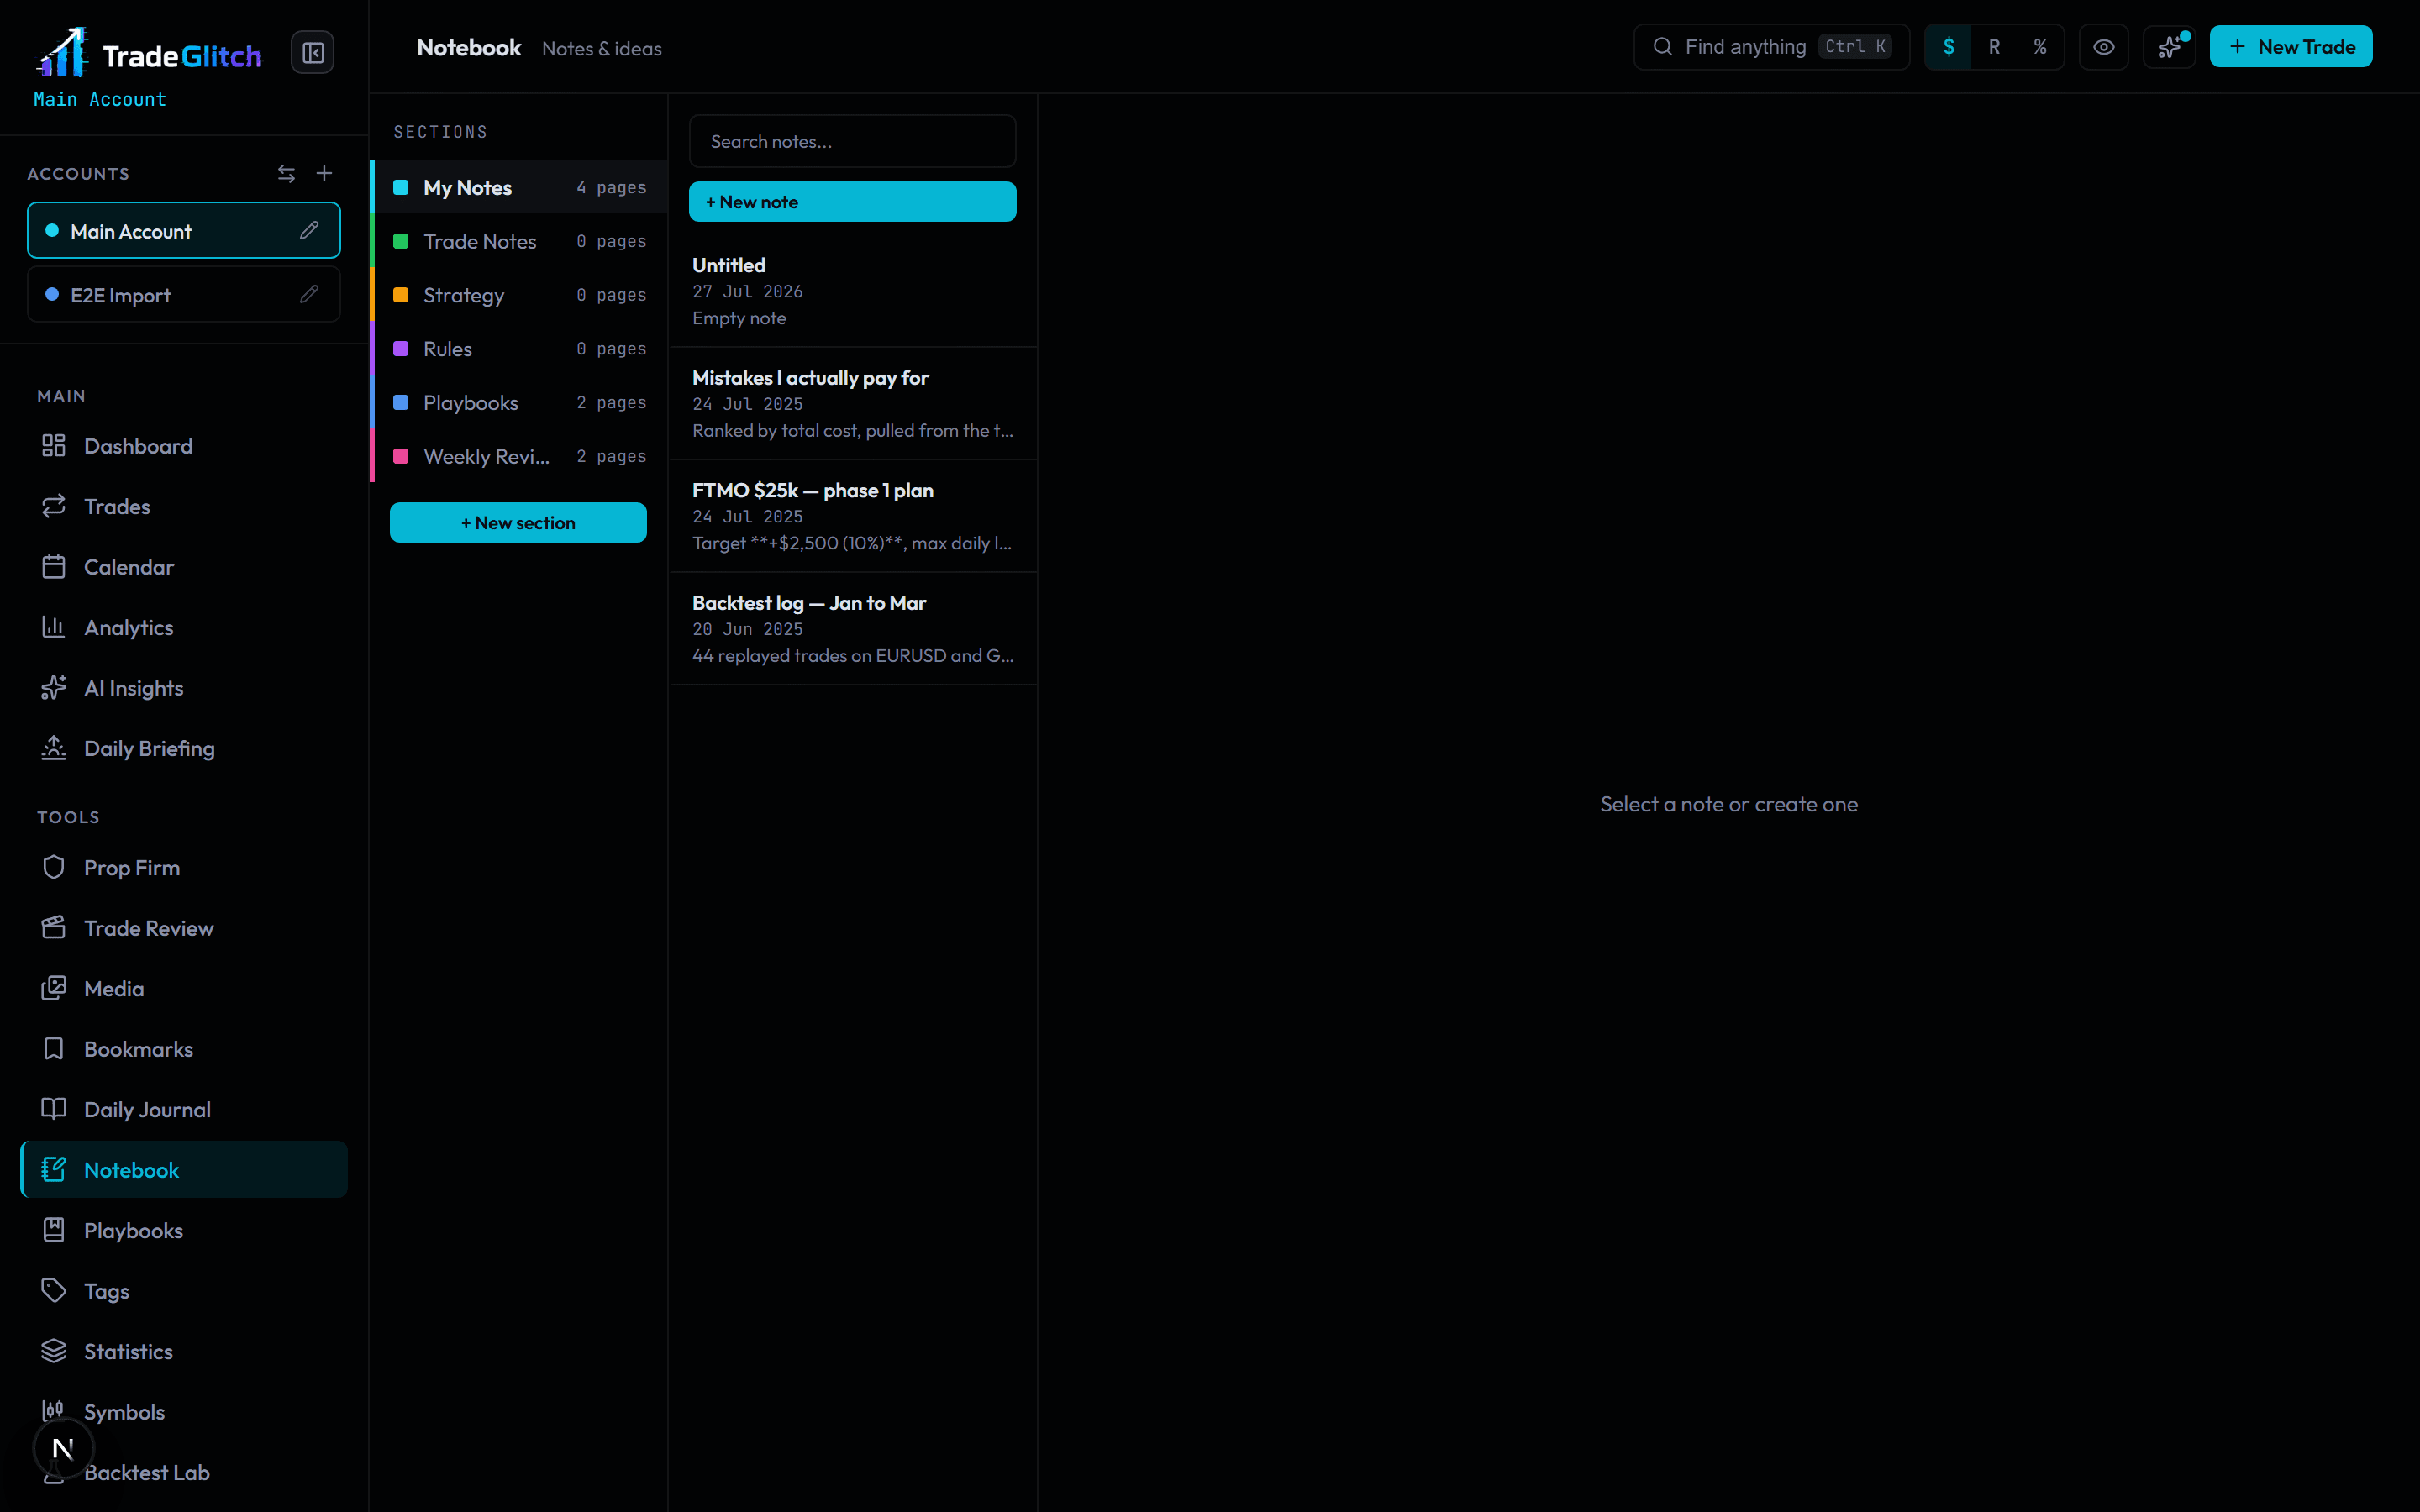
Notebook
A proper notebook in colour-coded sections, with templates for pre-market plans, post-trade reviews and weekly recaps. Saved to your account, not to one browser.
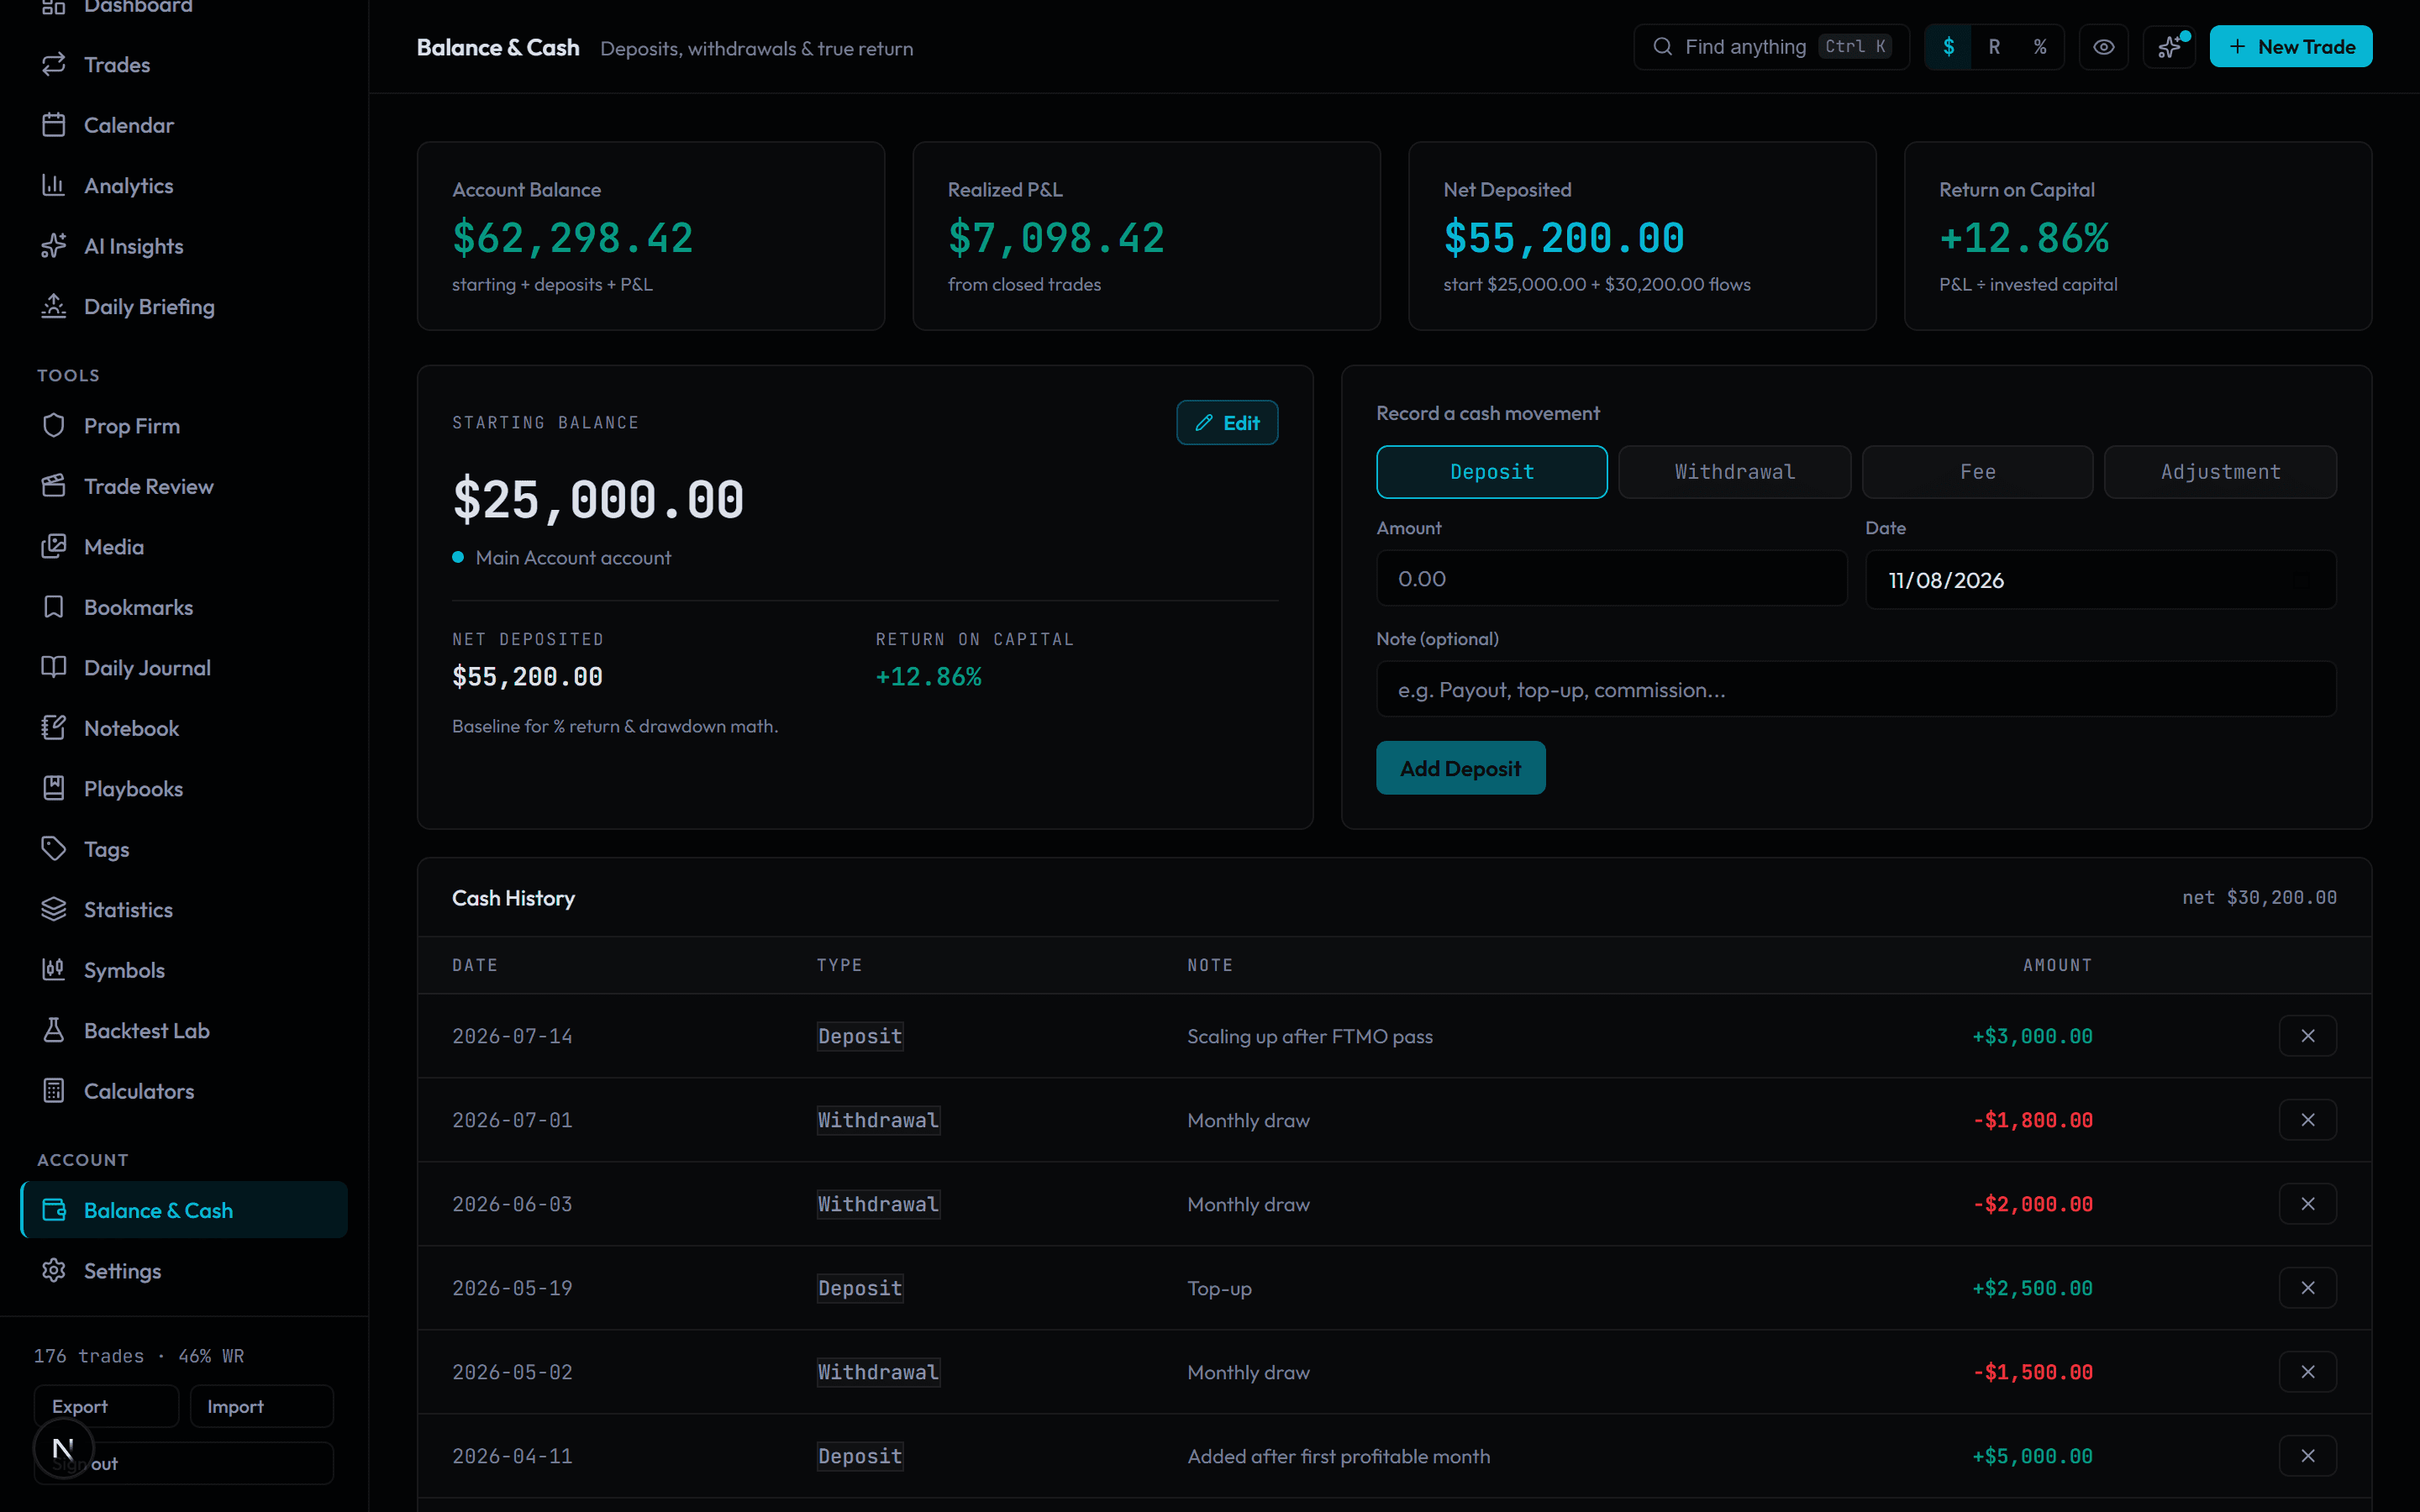
Balance & Cash
Log deposits, withdrawals and fees so your return is measured against what you actually funded. It's also what the drawdown and percentage views are anchored to.
Media gallery
Every chart screenshot you've ever attached, in one gallery — symbol, direction, result and tags under each. Find the chart you're thinking of without opening ten trades to get to it.
Share cards
Turn any trade or your week into a clean image built for Instagram, X or a Story. Add up to four of your own chart screenshots, and post a result in R or % if you'd rather not show dollars.
Search anything
One shortcut opens search across every page, trade, playbook, tag and setting. Bookmark the trades worth coming back to and keep them in named lists.
Mentor access
Give a coach, a prop firm or a trading partner a read-only link to your journal. They can see everything and change nothing, and you can revoke it whenever you like.
Import & export
Bring your history in from CSV, or restore a full JSON backup. Export the same way whenever you want — it stays your data, and you can take it with you.
Security
Two-factor authentication, a private storage bucket for your screenshots, and row-level database rules meaning nobody's account can reach anyone else's data.
Privacy & accessibility
Privacy mode blurs every dollar figure for screenshots and streaming. A colour-blind safe palette swaps wins and losses to blue and orange, and there's a light theme.
See it against your own trades.
Thirty days free, no card required. Import your history and the analytics have something to say on day one.
Start Free Trial